Scientific Analysis Donut Circle Graph
RJ0400019_7
- Last Update 05/22/2025
- File Size 0.6MB
- # of Slides 2
- File Format PPTX
- Slide Ratio 16:9
- Color
Keywords
- #Content-Based Slides
- #Design-Based Slides
- #Business Introduction
- #Market and Competitor Analysis
- #Graph
- #Technological Status
- #Market Share
- #Circles
- #Doughnut Chart
- #16:9
- #donut chart PowerPoint slide
- #donut graph template
- #data ratio visualization PPT
- #scientific analysis chart
- #pie chart presentation template
About the Product
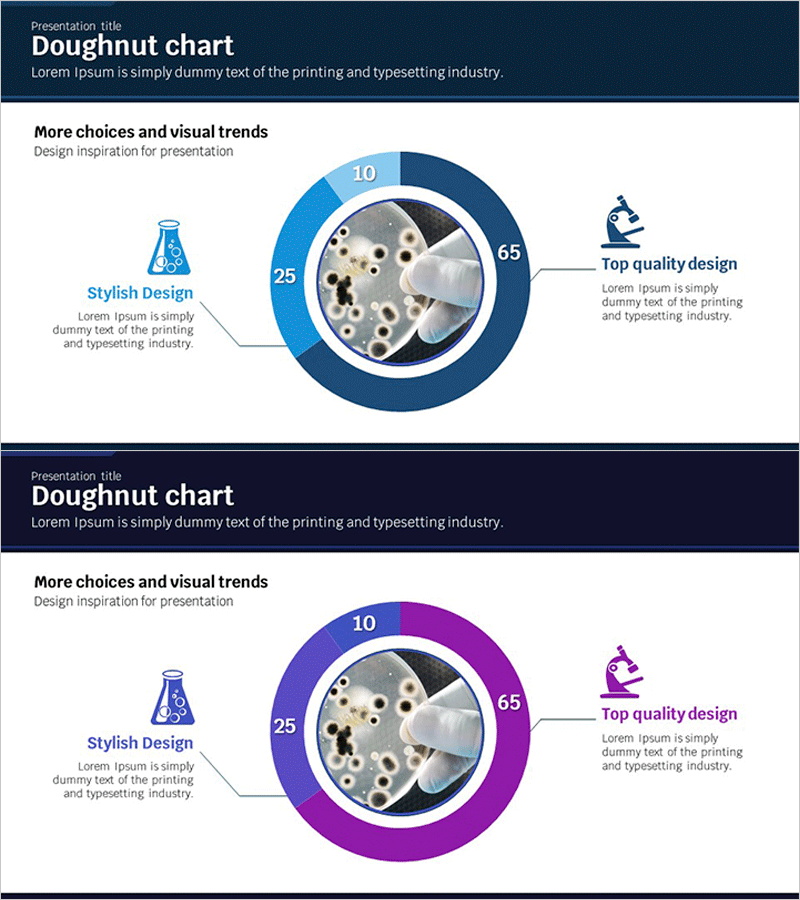
A professional donut chart PowerPoint slide template designed for scientific analysis and market research presentations. This slide features a central image or text area surrounded by a segmented outer ring displaying four data points with numerical ratios, creating an integrated visual narrative. Available in three color schemes—navy blue, light blue, and purple—each slide is formatted in 16:9 widescreen for modern presentation environments. Perfect for visualizing research findings, market analysis data, product performance comparisons, and quantitative metrics. Fully editable PPTX format allows instant customization to match your presentation style and data requirements.
Usage Points
-
Main Usage
Visualize the proportional relationships of four key data points—such as research outcomes, market segments, performance metrics, or survey results—in a single, cohesive graphic. The central focal point combined with the outer ring segments creates a balanced composition that emphasizes both the overall context and individual data components.
-
How to Use
Insert this slide into the analysis or results section of your presentation. Enter item names and numerical values into each of the four ring segments, and place a representative image or key message in the central circle. Adjust colors to align with your brand identity or presentation theme using PowerPoint's built-in color tools.
-
Recommended For
Researchers, data analysts, marketing professionals, consultants, and business strategists presenting market analysis, experimental results, customer segmentation, or performance dashboards. Suitable for academic presentations, executive briefings, client proposals, and strategic planning sessions.
-
Slide Structure
Two-slide set. Each slide contains a central circular area (for image or text insertion) + outer donut ring (4 segmented sections with numerical and label fields) + left-side icon and text area (for supplementary information). 16:9 widescreen format, fully editable PPTX.
Related Products
-

Visualizing Subjects with Donut Charts – A Master of Information Delivery
#Product/Service Introduction #Business Introduction #Market and Competitor Analysis
-

Visualizing Market Share with Donut Chart – Effective Business Analysis
#Business Introduction #Market and Competitor Analysis #Graph
-

Learning Icon and Donut Chart Ratio – Effective Market and Competitor Analysis
#Business Introduction #Market and Competitor Analysis #Graph
-

Donut Graph by Caries Erosion Status – Essential for Market Analysis
#Business Introduction #Market and Competitor Analysis #Graph
