Premium Management Presentation – Pie Business Model
RJ0200031_5
- Last Update 04/06/2025
- File Size 7.7MB
- # of Slides 2
- File Format PPTX
- Slide Ratio 16:9
- Color
Keywords
- #Content-Based Slides
- #Design-Based Slides
- #Company Introduction
- #Financial Plans and Performance
- #Graph
- #Key Achievements
- #Projected Return on Investment (ROI)
- #Circles
- #Doughnut Chart
- #16:9
- #donut pie chart PowerPoint
- #circular chart slide template
- #business model presentation
- #3-segment ratio chart
- #pie chart PowerPoint template download
About the Product
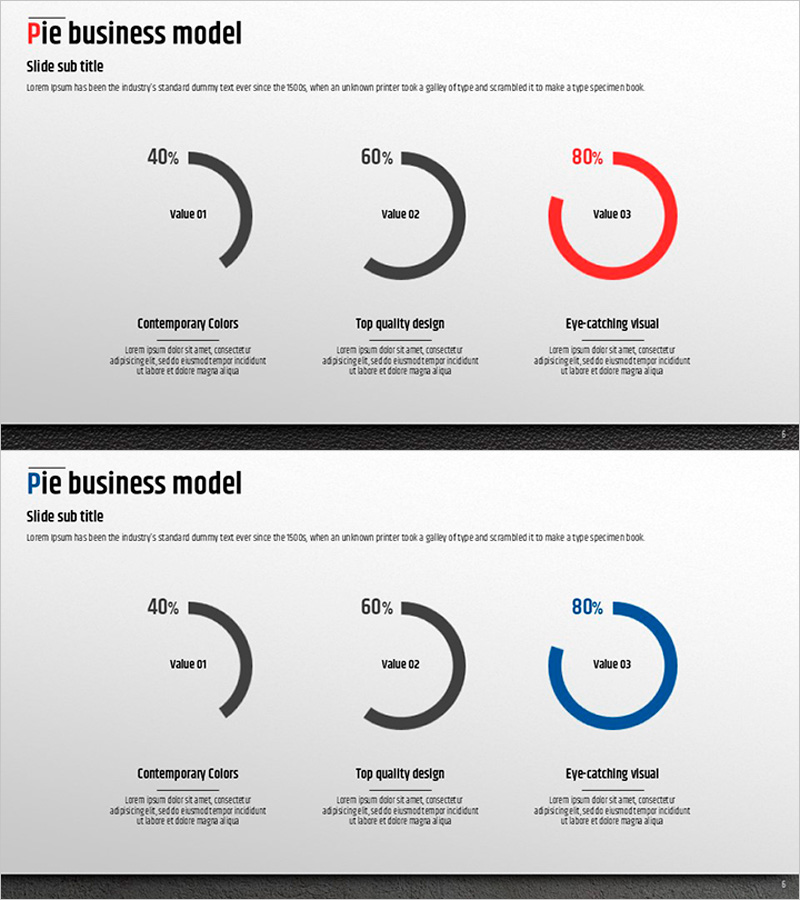
A professional donut pie chart PowerPoint slide that visualizes your business model's core values across three segments at 40%, 60%, and 80% ratios. This presentation slide features three circular charts arranged horizontally, each with distinct color coding—gray, red, and blue—to differentiate stages and improve readability. Below each chart is a dedicated text area for describing business strategy, value propositions, or key performance indicators. The 16:9 widescreen format includes two fully editable slides ready for immediate use in corporate presentations, investor pitches, and strategic reports.
Usage Points
-
Main Usage
Communicate business model core values, market share distribution, and strategic priorities to executives, investors, and team members using data-driven visual representation. The three-segment ratio comparison clearly illustrates competitive advantages and growth stages in a single, impactful slide.
-
How to Use
Insert this slide into company overview presentations, business plans, investor pitch decks, or strategic reports to visualize your business model's three key pillars. Edit the text labels below each chart to reflect your specific business elements—such as 'Contemporary Colors', 'Top Quality Design', and 'Eye-catching Visual'—and adjust the percentage values to match your actual data.
-
Recommended For
Executives, business development teams, marketing professionals, management consultants, and startup founders presenting business model analysis, competitive positioning, or strategic roadmaps. Ideal for emphasizing three core business values or illustrating phased growth strategies in corporate presentations.
-
Slide Structure
Slide 1: Three donut pie charts (40%, 60%, 80% segments) arranged horizontally with title and description text areas beneath each chart. Slide 2: Color variant version (gray, blue, red palette) for flexible presentation contexts. All elements are fully editable in PPTX format for seamless customization.
Related Products
-

Food Preference Analysis – Data Visualization Slide
#Company Introduction #Financial Plans and Performance #Graph
-

Revenue Mix Portfolio Slide – 3-Segment Dark Red & Purple
#Company Introduction #Graph #Key Achievements
-

Blue Line Wide Template Donut Chart – Performance Analysis
#Company Introduction #Market and Competitor Analysis #Graph
-

In-Depth Analysis Based on 70% Donut Chart – Insightful Market Share Insights
#Market and Competitor Analysis #Financial Plans and Performance #Graph
