Premium Management Template with Donut Chart for Performance Visualization
RJ0200031_11
- Last Update 04/06/2025
- File Size 7.7MB
- # of Slides 2
- File Format PPTX
- Slide Ratio 16:9
- Color
Keywords
- #Content-Based Slides
- #Design-Based Slides
- #Business Introduction
- #Business Strategy
- #Graph
- #Technological Status
- #Achievements
- #Circles
- #Doughnut Chart
- #16:9
- #donut chart PowerPoint slide
- #pie chart template download
- #ratio comparison slide
- #performance visualization PPT
- #donut graph presentation template
About the Product
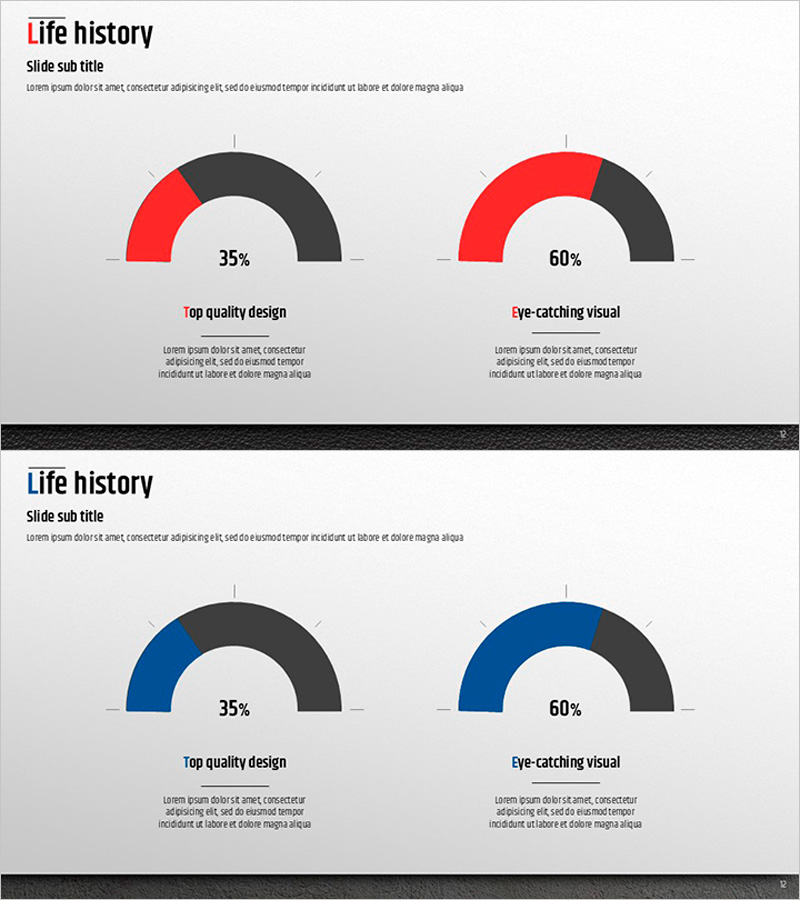
A professional donut chart PowerPoint slide designed to visualize performance metrics and proportional data with clarity and impact. Two donut graphs in contrasting red and blue tones display 35% and 60% ratios side by side, making comparative analysis immediately visible to your audience. This 16:9 widescreen 2-slide set is ready for business performance reports, goal achievement tracking, market share analysis, and revenue breakdowns. Each chart includes a dedicated text area below for adding context and insights, while all colors, percentages, and labels are fully editable to match your presentation needs.
Usage Points
-
Main Usage
Ideal for presenting two related metrics side by side—such as actual vs. target performance, market share comparison, or year-over-year growth rates. The donut format with centered space allows you to highlight key figures and draw audience focus to critical data points.
-
How to Use
Perfect for executive dashboards, quarterly business reviews, investor presentations, and strategic planning meetings. Insert your data into the editable chart areas, customize the percentages, and add supporting analysis text below each donut to provide full context and interpretation.
-
Recommended For
Business executives, financial analysts, marketing managers, project managers, and consultants who need to communicate quantitative results with visual clarity. Especially valuable for board meetings, performance reviews, budget presentations, and stakeholder updates.
-
Slide Structure
2-slide deck featuring dual donut charts per slide (red and blue color-coded). Each chart displays percentage values (35% and 60% examples) with centered numeric display. Title and descriptive text areas positioned below each chart pair for flexible content customization.
Related Products
-

Donut Pie Chart for Medical Technology – Market Share Analysis
#Business Introduction #Market and Competitor Analysis #Graph
-

Donut Graph by Caries Erosion Status – Essential for Market Analysis
#Business Introduction #Market and Competitor Analysis #Graph
-

Modern Business Presentation Template Doughnut Chart1 – Visualizing Performance and Strategy
#Business Strategy #Risk Management and Regulatory Compliance #Graph
-

Academic Ability Donut Chart – Visual Performance Analysis
#Company Introduction #Business Introduction #Graph
