Cat Donut Chart – Data Analysis and Creativity
RJ0800040_13
- Last Update 08/11/2025
- File Size 0.4MB
- # of Slides 2
- File Format PPTX
- Slide Ratio 16:9
- Color
Keywords
- #Content-Based Slides
- #Design-Based Slides
- #Product/Service Introduction
- #Business Introduction
- #Diagram
- #Graph
- #Development Status
- #Technological Status
- #Spread
- #Circles
- #Centralized Diagram
- #Doughnut Chart
- #16:9
- #donut chart PowerPoint
- #pie chart slide template
- #5-segment data visualization
- #percentage breakdown presentation
- #donut diagram slide design
About the Product
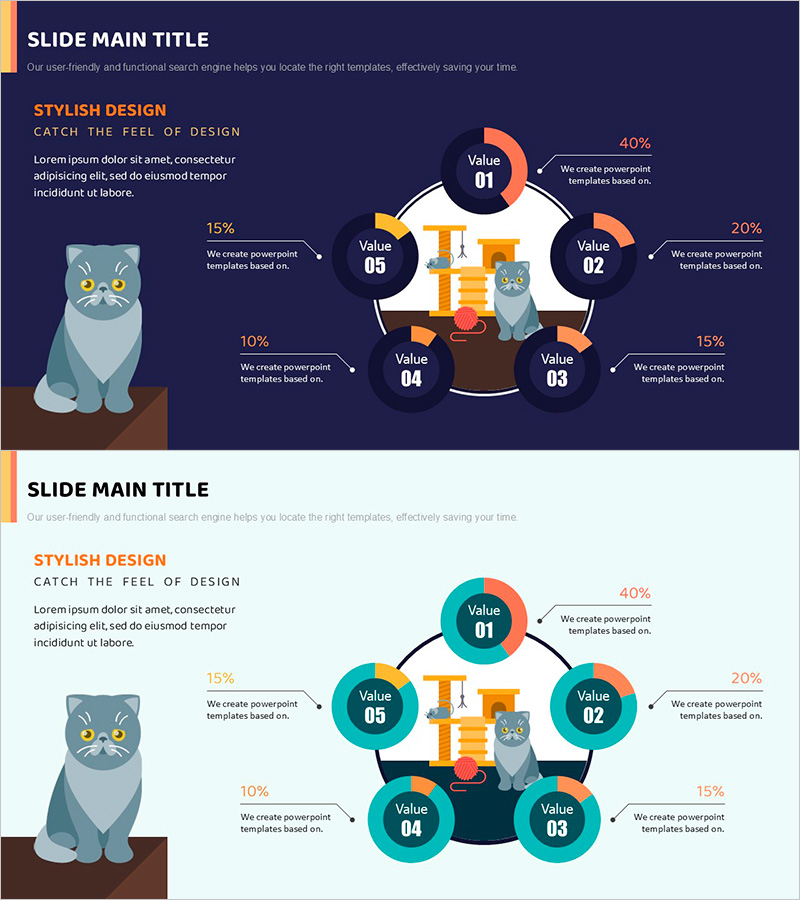
A PowerPoint slide template featuring a 5-segment donut chart with a cat character at the center and five circular nodes (Value 01–05) connected by arrows around the perimeter. Each node displays a percentage value (40%, 20%, 15%, 10%, 15%) in orange and white accents against a dark navy background. The left side includes a text area for title and description. Two slide layouts are provided: a dark theme and a light theme version, both in 16:9 widescreen PPTX format. Ideal for visualizing business metrics such as data analysis, marketing performance, development progress, and customer satisfaction across five categories.
Usage Points
-
Main Usage
Displays the proportion, composition, and market share of five data categories in a single donut chart format. The hierarchical arrangement of the central character and surrounding nodes emphasizes both core data and detailed items, while percentage values and text descriptions enhance audience comprehension.
-
How to Use
Apply this slide to marketing performance reports, business analysis, development progress tracking, customer satisfaction surveys, and portfolio presentations involving five or fewer data categories. Simply replace the percentage values and text with your own data, adjust colors to match your brand identity, and choose between the dark or light theme version based on your presentation environment.
-
Recommended For
Recommended for marketing teams presenting campaign performance, development teams reporting project status, sales teams analyzing customer distribution, and executives presenting business portfolio composition. Particularly effective in data-driven decision-making meetings, quarterly reports, and investor pitch decks where proportional information must be communicated intuitively.
-
Slide Structure
Two-slide set with dark navy and light gray background versions. Each slide features a two-column layout with text area (title and description) on the left and donut chart on the right. Five circular nodes are arranged radially around the central cat character, with percentage labels and connecting arrows. Provided in 16:9 widescreen PPTX format.
Related Products
-

Visualizing Military Data with Donut Chart – Power of Trust
#Product/Service Introduction #Business Introduction #Diagram
-

Space Industry Development Status Graph – Capturing the Future of Industry
#Product/Service Introduction #Business Introduction #Graph
-

Four Color Infographic – Business Status Presentation
#Product/Service Introduction #Business Introduction #Graph
-

Status of Parts Production and Development – Donut Chart Infographic
#Product/Service Introduction #Business Introduction #Graph
