Idea Presentation Template for Visualizing Sales Status – Success and Challenge
RJ0200030_14
- Last Update 04/06/2025
- File Size 0.7MB
- # of Slides 2
- File Format PPTX
- Slide Ratio 16:9
- Color
Keywords
- #Content-Based Slides
- #Design-Based Slides
- #Market and Competitor Analysis
- #Financial Plans and Performance
- #Graph
- #Market Status
- #Sales and Revenue
- #Column
- #Grouped Column
- #16:9
- #grouped bar chart PowerPoint
- #data comparison slide template
- #2-series bar graph
- #positive negative values visualization
- #business chart template download
About the Product
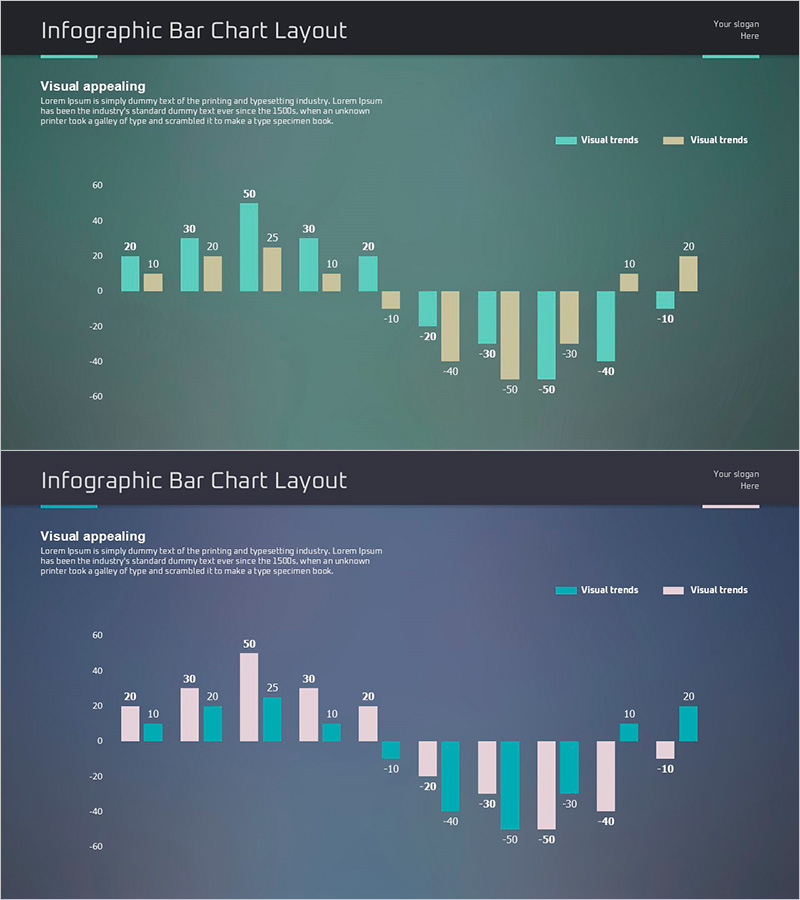
A 2-slide grouped bar chart PowerPoint template for visualizing success and challenge metrics side by side. The design uses teal and beige color series to contrast comparative data, supporting both positive and negative values for comprehensive business analysis. Delivered in 16:9 widescreen PPTX format with fully editable elements, this slide deck is ready for sales performance, market analysis, and competitive benchmarking presentations. Each slide includes title and description areas with clearly labeled data points, making it ideal for data-driven decision-making materials in corporate settings.
Usage Points
-
Main Usage
Enables side-by-side comparison of two categories or time periods to highlight performance, challenges, and trends at a glance. The dual-axis design accommodates both positive and negative values, making it ideal for profit-loss analysis, revenue tracking, and variance reporting. Commonly used in marketing, finance, and operations presentations to communicate key performance indicators effectively.
-
How to Use
Adjust bar heights and colors to match your dataset, then update legend labels and axis titles accordingly. Add your analysis topic to the title area and supporting insights to the description section to enhance audience comprehension. Maintain the color scheme while modifying data values to repurpose the template across multiple presentations and reporting cycles.
-
Recommended For
Finance teams, marketing departments, and sales divisions presenting monthly or quarterly performance reviews. Ideal for executive decision-making materials, investor pitch decks, and consulting proposals requiring comparative analysis. Particularly effective when presenting two scenarios, strategies, or products that require quantitative side-by-side evaluation.
-
Slide Structure
2-slide layout with title and description text areas at the top, and a grouped bar chart occupying the lower section. The chart displays approximately 10-15 categorical items on the X-axis with 2 data series (teal and beige) on the Y-axis, clearly distinguishing positive and negative value ranges. Data labels appear above each bar segment for precise numerical communication.
Related Products
-

Stylish Comparative Column Graph – Market Status and Performance Comparison
#Market and Competitor Analysis #Financial Plans and Performance #Graph
-

Analysis of Ship Order Volume – Effective Market Status Graph
#Market and Competitor Analysis #Financial Plans and Performance #Graph
-

AI VC Market Statistics PowerPoint Slide – Bar Chart and KPI
#Market and Competitor Analysis #Financial Plans and Performance #Graph
-

Analysis of Changes in Avocado Purchases with Horizontal and Vertical Bar Graphs
#Market and Competitor Analysis #Graph #Market Status
