Analysis of Ship Order Volume – Effective Market Status Graph
RJ0800006_9
- Last Update 03/18/2025
- File Size 6.5MB
- # of Slides 4
- File Format PPTX
- Slide Ratio 16:9
- Color
Keywords
- #Content-Based Slides
- #Design-Based Slides
- #Market and Competitor Analysis
- #Financial Plans and Performance
- #Graph
- #Market Status
- #Sales and Revenue
- #Column
- #Grouped Column
- #16:9
- #grouped bar chart PowerPoint
- #horizontal vertical bar graph template
- #market analysis chart slide
- #order volume comparison
- #data visualization PowerPoint slide
About the Product
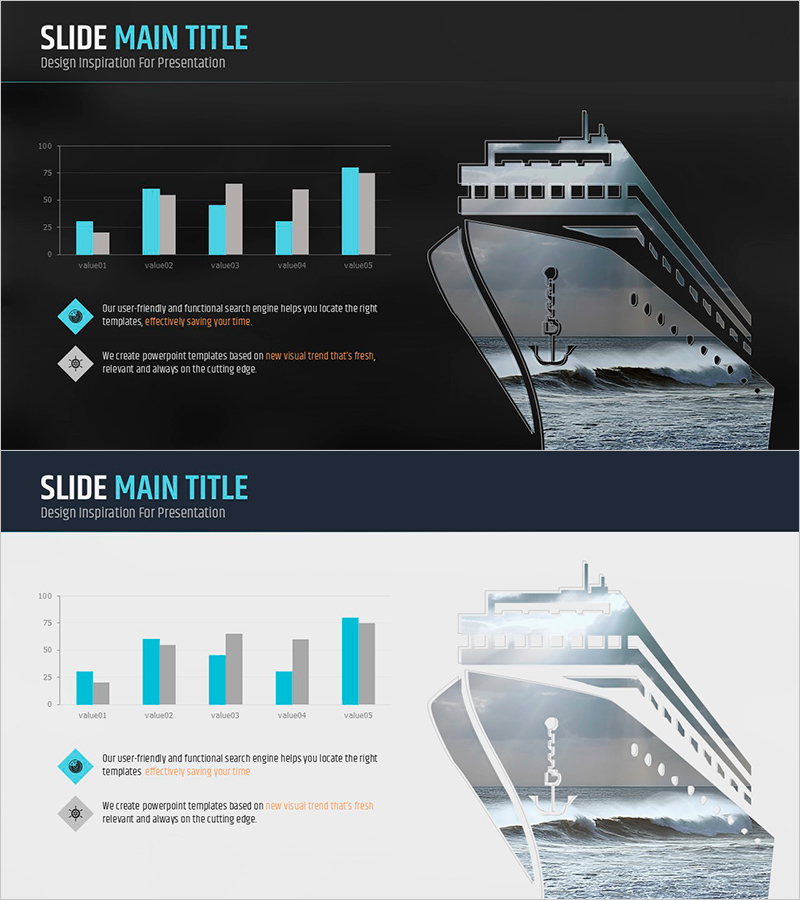
A grouped bar chart PowerPoint slide template designed to analyze ship order volumes and market conditions effectively. This 4-slide set provides both horizontal and vertical bar charts to compare the same data from multiple perspectives. Featuring a dark background with cyan and gray transparent bars, it's ready for immediate use in financial analysis, market research, and business reports. Each slide visualizes 5-item numerical comparisons with clarity, making it suitable for shipbuilding, manufacturing, logistics, and financial sector presentations.
Usage Points
-
Main Usage
Compare multiple data points across 5 categories using grouped bar charts in both horizontal and vertical formats to clearly communicate market trends and performance metrics. Supports data-driven decision-making in financial analysis, business reports, and investor presentations.
-
How to Use
Replace the 5 item labels and numerical values with your own data for immediate use. Horizontal bars work best for long category names, while vertical bars suit time-series comparisons. The dark background ensures excellent readability in projector presentations.
-
Recommended For
Finance and planning teams presenting quarterly or annual reports, shipbuilding and maritime industry market analysis, manufacturing and logistics sales volume comparisons, investor relations presentations, consulting reports requiring data visualization sections.
-
Slide Structure
4-slide set: Title slide with dark background and ship imagery, horizontal grouped bar chart (5 items, 2-series comparison), light background horizontal bar chart (same data), and vertical grouped bar chart (5 items, 2-series). All charts are fully editable shapes.
Related Products
-

Stylish Comparative Column Graph – Market Status and Performance Comparison
#Market and Competitor Analysis #Financial Plans and Performance #Graph
-

Idea Presentation Template for Visualizing Sales Status – Success and Challenge
#Market and Competitor Analysis #Financial Plans and Performance #Graph
-

Market Analysis with Five Color Pie Charts – Stylish Design
#Market and Competitor Analysis #Financial Plans and Performance #Graph
-

Sales and Profit Table – Visualizing Financial Performance
#Market and Competitor Analysis #Financial Plans and Performance #Diagram
