Idea Presentation Template Wide – Market Analysis and Visualization
RJ0200030_13
- Last Update 04/06/2025
- File Size 1.2MB
- # of Slides 2
- File Format PPTX
- Slide Ratio 16:9
- Color
Keywords
- #Content-Based Slides
- #Design-Based Slides
- #Market and Competitor Analysis
- #Graph
- #Other
- #Market Status
- #Market Analysis
- #Circles
- #Doughnut Chart
- #Map
- #16:9
- #Europe map PowerPoint slide
- #world map presentation template
- #donut chart PPT
- #geographic data visualization
- #market analysis slides
- #regional data representation
About the Product
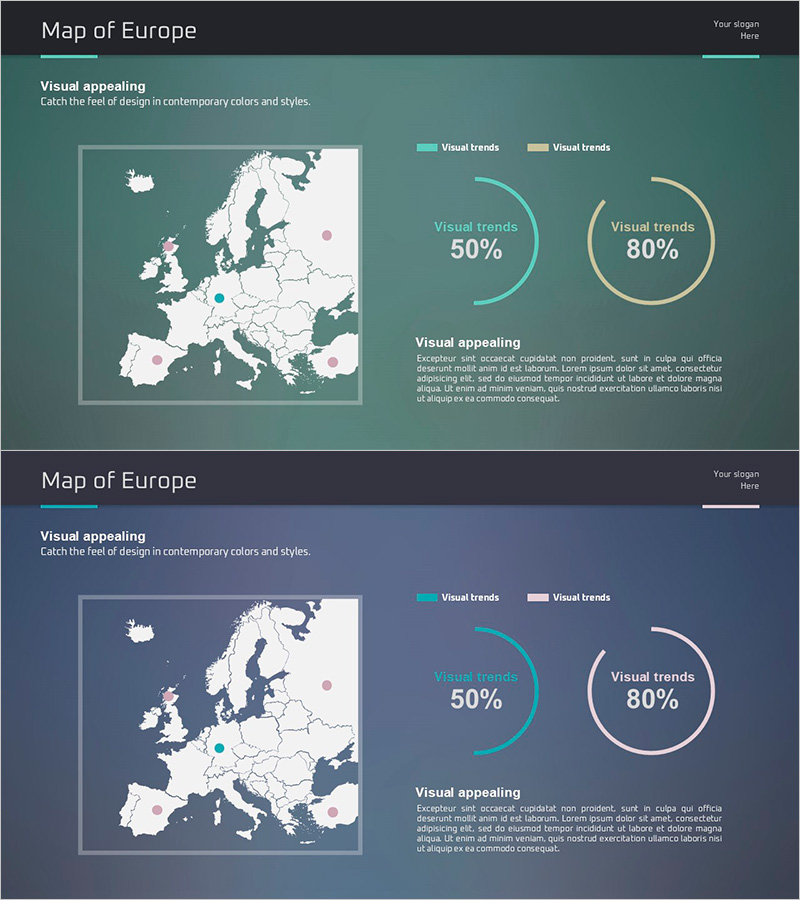
A 2-slide PowerPoint presentation combining a detailed Europe map with dual donut charts for market analysis visualization. Circular data markers are positioned across the map to highlight regional distribution, while two donut charts on the right display percentage breakdowns. Includes two color versions: teal background and navy background, both in 16:9 widescreen format. Ready-to-use slides for regional market entry strategies, geographic performance analysis, and global network presentations.
Usage Points
-
Main Usage
Visualize European regional market size, sales performance, and customer distribution simultaneously using map markers and donut charts. The circular markers emphasize key regional hubs while the donut charts clearly show each region's proportion of the total market, enabling stakeholders to grasp global business status at a glance.
-
How to Use
Choose between teal or navy background versions depending on your presentation theme. Edit the map markers and chart percentages with your actual data for immediate use. Ideal for regional performance comparisons, global expansion strategy presentations, and international marketing status reports. All elements are fully editable in PowerPoint.
-
Recommended For
Global business managers, marketing strategists, sales directors, and executives preparing regional performance reports. Particularly valuable for European market entry presentations, international partner briefings, and geographic sales analysis discussions.
-
Slide Structure
Slide 1 (Teal background): Europe map centered, 5 circular data markers distributed across regions, 2 donut charts (50% and 80% indicators) positioned right side. Slide 2 (Navy background): identical layout with color variation. Both slides include title area, legend box, and text description zone.
Related Products
-

Real Estate Performance Status Donut Graph – Essential for Market Analysis
#Market and Competitor Analysis #Graph #Market Status
-

Global Market Analysis Chart – Market Trends and Data Visualization
#Company Introduction #Market and Competitor Analysis #Graph
-

Horizontal Bar Chart Slide for USA Market Analysis
#Market and Competitor Analysis #Graph #Other
-

Stylish Design Business Presentation Template
#Market and Competitor Analysis #Graph #Market Status
