Business Status Chart – Presentation Template for Market Analysis
RB0100035_7
- Last Update 03/04/2025
- File Size 1.8MB
- # of Slides 2
- File Format PPTX
- Slide Ratio 4:3
- Color
Keywords
- #Content-Based Slides
- #Design-Based Slides
- #Market and Competitor Analysis
- #Diagram
- #Graph
- #Market Status
- #Market Analysis
- #Table
- #Circles
- #Standard Table
- #Doughnut Chart
- #4:3
- #doughnut chart PowerPoint slide
- #pie chart presentation template
- #ratio visualization PPT
- #business status chart
- #circular graph slide design
About the Product
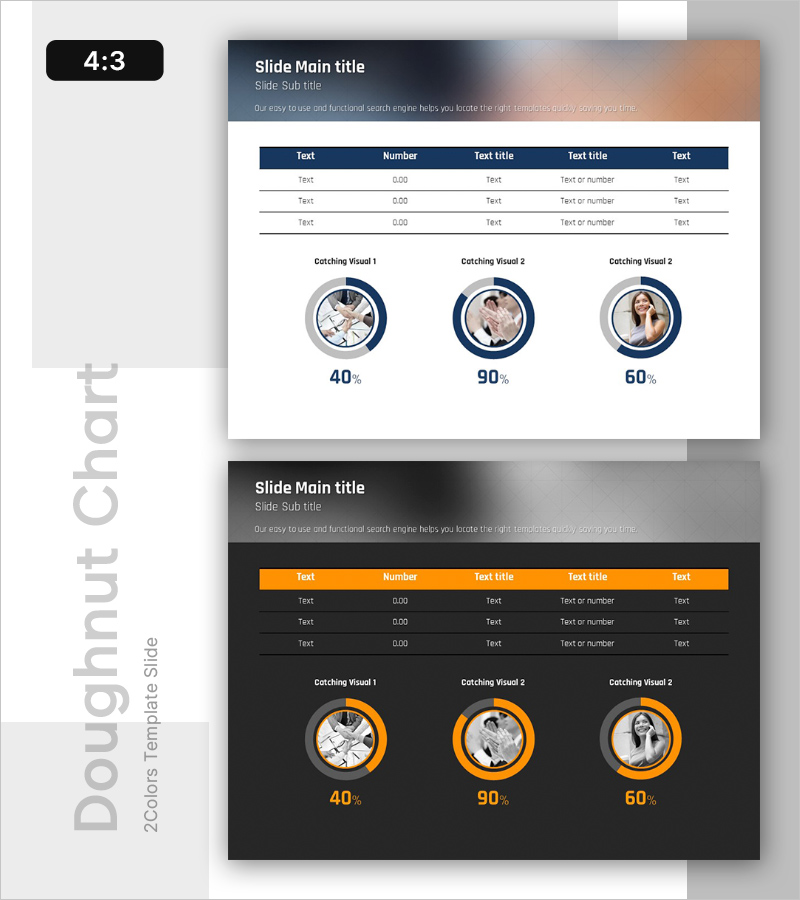
A doughnut chart PowerPoint slide designed for business status and market analysis presentations. This 2-slide template features three-item ratio visualization with navy blue and gray tones. Each doughnut chart includes a circular image placeholder in the center for inserting photos, icons, or logos, with percentage values displayed below. The structured layout enables clear data comparison and visual storytelling. Ideal for executive reports, investor pitches, and strategic presentations requiring proportion-based data communication.
Usage Points
-
Main Usage
Visualize three-item proportional relationships such as business performance metrics, market share distribution, or customer segmentation. The center image placeholder allows simultaneous display of data and visual elements—employee photos, product images, or brand logos—creating a comprehensive narrative around the data.
-
How to Use
Apply this slide in executive briefings, investor presentations, and marketing strategy sessions to explain business results, market analysis findings, or customer composition ratios. Edit the chart colors and percentages to reflect actual data, then add relevant images to the center placeholders to enhance audience engagement and message retention.
-
Recommended For
Executives, marketing managers, business analysts, consultants, and sales leaders presenting data-driven insights. Suitable for quarterly business reviews, market entry strategy presentations, customer segmentation analysis, and performance reporting where proportion-based data requires emphasis.
-
Slide Structure
2-slide layout with one doughnut chart per slide. Each chart features three segments in navy blue, orange, and gray tones, a circular image insertion area in the center, and percentage labels (40%, 90%, 60%) positioned below. Horizontal 4:3 aspect ratio supports standard presentation displays.
Related Products
-

Visualizing Board Members and Shareholders with a Sleek Diagram
#Company Introduction #Market and Competitor Analysis #Diagram
-

Visual Insights on Education Analysis PowerPoint
#Market and Competitor Analysis #Diagram #Graph
-

Stylish Design Business Presentation Template
#Market and Competitor Analysis #Graph #Market Status
-

Donut Chart: Feature Usage Ratio in Mobile Banking
#Market and Competitor Analysis #Diagram #Graph
