Real Estate Performance Status Donut Graph – Essential for Market Analysis
RJ0900020_24
- Last Update 08/21/2025
- File Size 6.2MB
- # of Slides 2
- File Format PPTX
- Slide Ratio 16:9
- Color
Keywords
About the Product
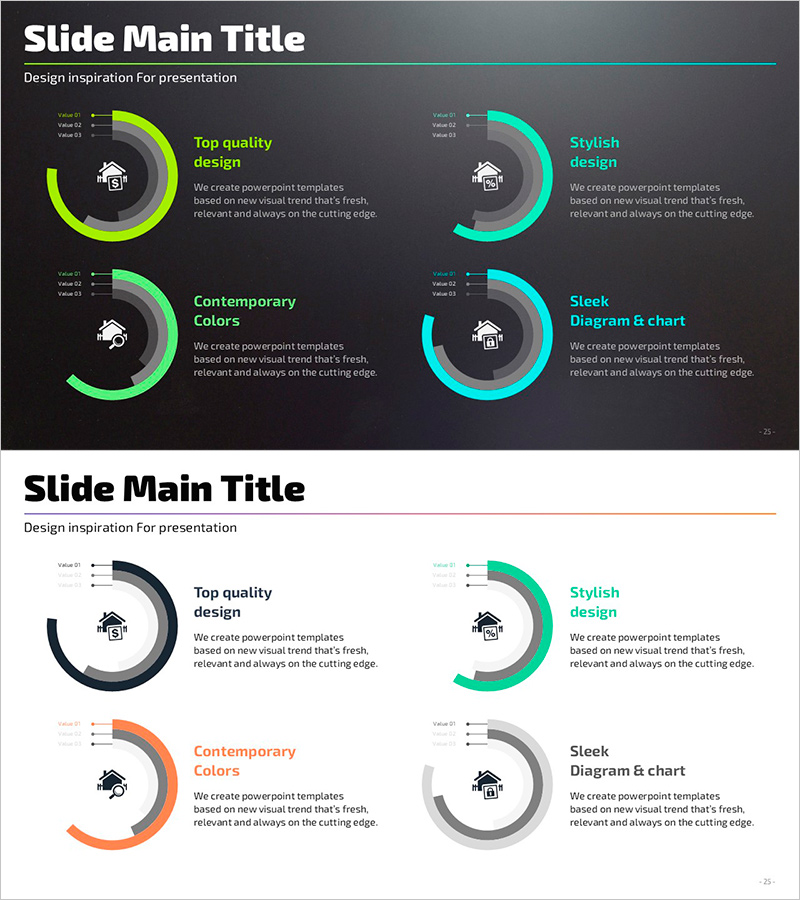
A 4-segment donut chart PowerPoint slide designed to visualize real estate market analysis and performance metrics. Set against a dark background, the circular chart uses lime green, cyan, orange, and gray to distinguish regional sales, property types, quarterly results, and market segments. Each section includes icons and text labels for clear data interpretation. The 2-slide deck is ready to use immediately and optimized for real estate companies, property brokers, and construction firms presenting quarterly reports, market analysis, and investor presentations.
Usage Points
-
Main Usage
Displays four key metrics—regional sales distribution, property type breakdown, quarterly performance, or market segment composition—as proportional segments in a donut chart. The hollow center allows insertion of summary figures or titles, enhancing information clarity and visual hierarchy.
-
How to Use
Use in quarterly performance reports for real estate companies, market analysis presentations, investor pitch decks, property broker training materials, and construction project status updates. Edit segment colors and values to reflect actual data, and customize icons to match your category labels and branding.
-
Recommended For
Real estate company executives, marketing teams, and sales departments; property brokers and agents; construction company planners and project managers; real estate investment analysts; market research professionals; and financial institution real estate specialists presenting performance metrics and market insights.
-
Slide Structure
2-slide set. Slide 1 features a dark background with a 4-segment donut chart (lime green, cyan, orange, gray) with icons, labels, and numerical values per segment. Slide 2 uses a light background with the same donut structure in adjusted color tones for versatile presentation environments.
Related Products
-

Visual Insights on Education Analysis PowerPoint
#Market and Competitor Analysis #Diagram #Graph
-

Graph of Sales by Region – Visualizing Market Status
#Market and Competitor Analysis #Graph #Other
-

Stylish Design Business Presentation Template
#Market and Competitor Analysis #Graph #Market Status
-

Business Status Chart – Presentation Template for Market Analysis
#Market and Competitor Analysis #Diagram #Graph
