Horizontal Bar Chart for Customer Analysis – Highlighting Competitive Advantage
RJ0200029_8
- Last Update 04/06/2025
- File Size 0.5MB
- # of Slides 2
- File Format PPTX
- Slide Ratio 16:9
- Color
Keywords
- #Content-Based Slides
- #Design-Based Slides
- #Market and Competitor Analysis
- #Graph
- #Customer Analysis
- #Competitive Advantage
- #Horizontal Bar
- #Double Horizontal Bar
- #16:9
- #horizontal bar chart PowerPoint
- #back-to-back bar chart
- #gender comparison slide
- #customer analysis template
- #data visualization PowerPoint slide
About the Product
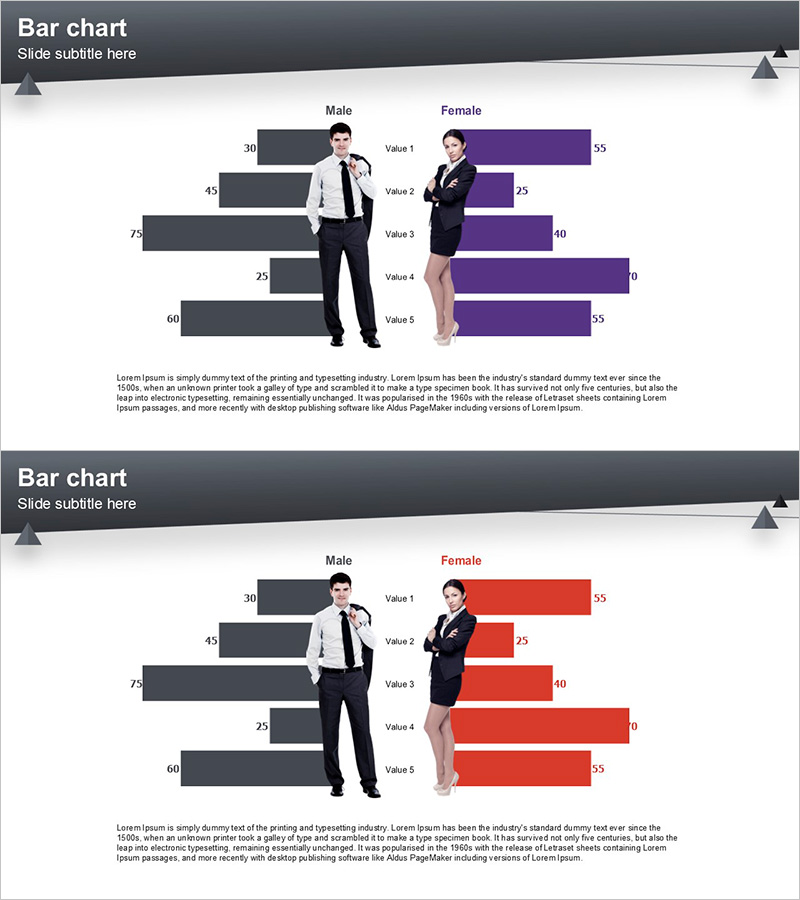
A horizontal bar chart PowerPoint slide designed for comparing male and female customer segments. The slide features five data items displayed in a back-to-back bar format, with dark gray bars on the left and purple bars on the right, creating a symmetrical visual comparison. Each bar includes numeric labels for precise data representation. Male and female character illustrations are positioned at the center to enhance visual balance and engagement. This presentation template is ready to use in business reports, market analysis, and customer segmentation presentations.
Usage Points
-
Main Usage
Ideal for comparing two groups across multiple categories such as customer demographics, competitive analysis, market research findings, and sales performance by segment. The symmetric bar layout makes numerical differences immediately apparent and supports data-driven decision-making.
-
How to Use
Open the slide and replace the category labels, numeric values, and colors with your own data. The left gray bars represent Group A or Male data, while the right purple bars represent Group B or Female data. You can remove or replace the character illustrations with your company logo or other visuals as needed. The slide is optimized for 16:9 widescreen format.
-
Recommended For
Marketing teams presenting customer analysis, sales reports showing gender or demographic breakdowns, HR departments comparing organizational composition, consulting firms presenting market research, and product teams analyzing user segmentation data.
-
Slide Structure
Two-slide set. Each slide contains a title and subtitle area plus the bar chart visualization. The chart displays five rows of data (values: 30, 45, 75, 25, 60) with symmetric bars extending left (0–75 range) and right (0–55 range). A text description area at the bottom allows for additional analysis notes or insights.
Related Products
-

Gender Ratio Analysis Bar Graph – Customer Analysis and Competitive Advantage
#Market and Competitor Analysis #Graph #Customer Analysis
-

Two-way Chart of Male and Female Surveys – Gender Comparison Visualization
#Market and Competitor Analysis #Graph #Customer Analysis
-

Statistics on People's Physical Fitness in Bar Chart – Insights Aimed at Competitive Advantage
#Market and Competitor Analysis #Graph #Other
-

Real Estate Interactive Horizontal Bar Graph – Market Analysis and Performance
#Market and Competitor Analysis #Financial Plans and Performance #Graph
