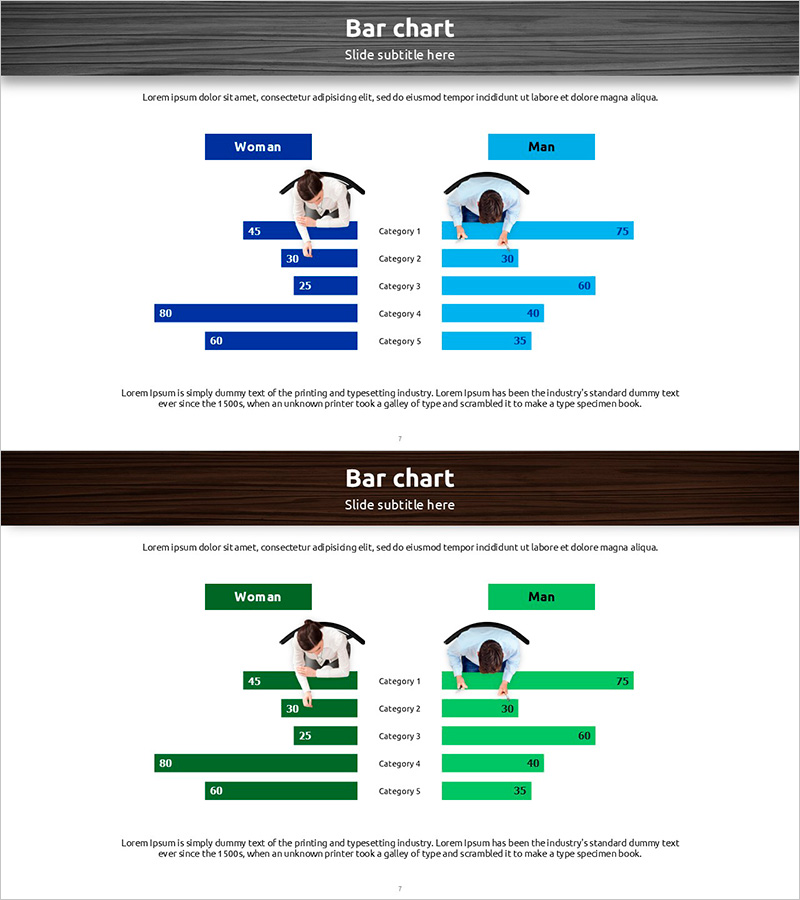
Two-way Chart of Male and Female Surveys – Gender Comparison Visualization
RJ0600077_6
- Last Update 07/10/2025
- File Size 6.5MB
- # of Slides 2
- File Format PPTX
- Slide Ratio 16:9
- Color
Keywords
- #Content-Based Slides
- #Design-Based Slides
- #Market and Competitor Analysis
- #Graph
- #Customer Analysis
- #Competitive Advantage
- #Horizontal Bar
- #Double Horizontal Bar
- #16:9
- #two-way horizontal bar chart
- #gender comparison chart PowerPoint
- #back-to-back bar graph
- #male female data visualization
- #horizontal bar chart slide template
About the Product
A two-way horizontal bar chart PowerPoint slide that compares male and female data in a left-right symmetric layout. The chart features two data series: dark blue bars for female respondents and light blue bars for male respondents, displaying five categories with numerical values. Each bar is labeled with precise data points, and the symmetric arrangement around a central axis makes gender differences immediately apparent. This PowerPoint slide is ready to use for customer analysis, market research, gender preference surveys, and demographic comparisons in business presentations.
Usage Points
-
Main Usage
This chart compares male and female data using a symmetric left-right structure. It visualizes gender-based differences in customer satisfaction, product preferences, survey response rates, and market share, making it ideal for data-driven decision-making presentations.
-
How to Use
Enter female data on the left side and male data on the right side; the symmetric layout automatically aligns them. Modify category names and numerical values to reflect your survey results, and adjust colors to match your brand guidelines. The 2-slide set allows you to present multiple datasets.
-
Recommended For
Marketing professionals, market research analysts, HR specialists, and executives preparing reports. Ideal for gender-based customer analysis, product preference studies, employee satisfaction surveys, gender-specific purchasing behavior analysis, and any presentation requiring gender comparison.
-
Slide Structure
2-slide set. Each slide features a central axis with 5 categories: left side (female, dark blue bars) and right side (male, light blue bars) in symmetric arrangement. Numerical labels appear at the end of each bar. Legend at top, category names in center, descriptive text area at bottom.
Related Products
-

Horizontal Bar Chart for Customer Analysis – Highlighting Competitive Advantage
#Market and Competitor Analysis #Graph #Customer Analysis
-

Statistics on People's Physical Fitness in Bar Chart – Insights Aimed at Competitive Advantage
#Market and Competitor Analysis #Graph #Other
-

Gender Ratio Analysis Bar Graph – Customer Analysis and Competitive Advantage
#Market and Competitor Analysis #Graph #Customer Analysis
-

Comparative Analysis Interactive Graph – Market Share Analysis
#Market and Competitor Analysis #Graph #Customer Analysis
