Gender Ratio Analysis Bar Graph – Customer Analysis and Competitive Advantage
RJ0300051_7
- Last Update 05/02/2025
- File Size 3.5MB
- # of Slides 2
- File Format PPTX
- Slide Ratio 16:9
- Color
Keywords
- #Content-Based Slides
- #Design-Based Slides
- #Market and Competitor Analysis
- #Graph
- #Customer Analysis
- #Competitive Advantage
- #Horizontal Bar
- #Double Horizontal Bar
- #16:9
- #horizontal bar chart PowerPoint
- #gender ratio analysis slide
- #customer analysis presentation
- #comparative data visualization
- #bar graph template download
About the Product
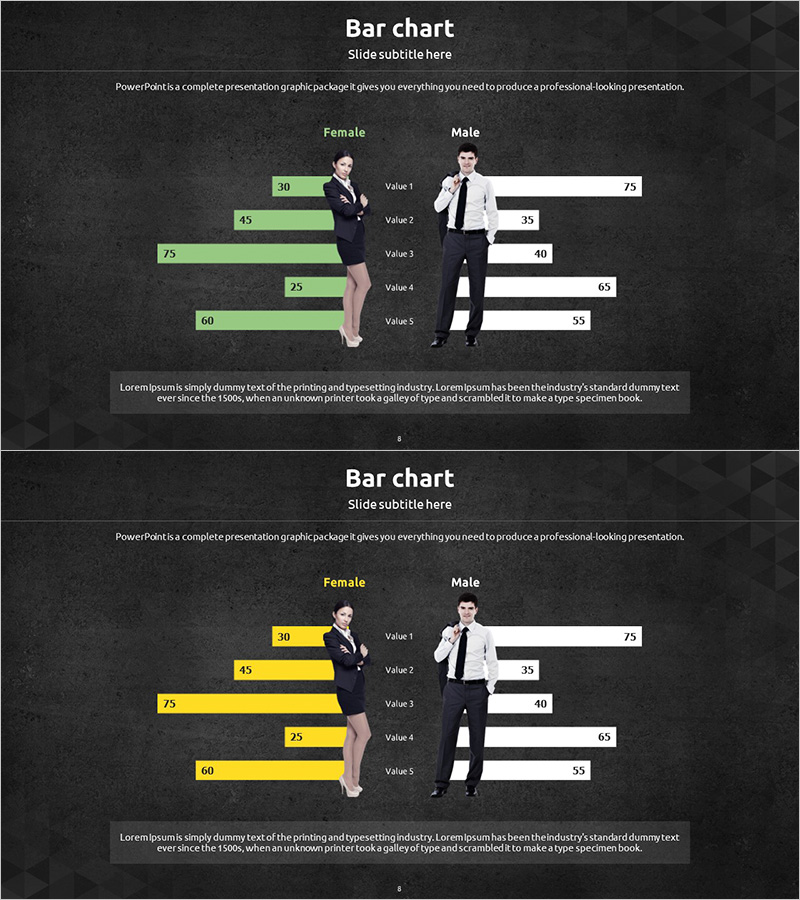
A horizontal bar chart PowerPoint slide designed for gender ratio analysis and comparative data visualization. The dark background features green and white bars arranged symmetrically left and right, enabling intuitive comparison between female and male data across 5 items (Value 1 through Value 5). Business character illustrations are positioned centrally to enhance visual appeal. This 16:9 widescreen slide deck includes 2 slides and is ready for immediate use in customer analysis, market research, competitive advantage presentations, and demographic studies. All numerical values, labels, and colors are fully editable.
Usage Points
-
Main Usage
This slide visualizes comparative data between two groups (such as gender, age group, or job level) across 5 categories using a horizontal bar chart format. The left-right symmetrical layout clearly highlights contrasts and differences, making it ideal for customer segmentation analysis, market surveys, competitive benchmarking, and performance reporting in business presentations.
-
How to Use
Replace the sample values (30, 45, 75, 25, 60) with your actual data and update the legend labels (Female/Male) and category names (Value 1–5) to match your presentation context. Colors can be customized to match your corporate brand guidelines. The dark background provides excellent contrast and readability in projector environments.
-
Recommended For
Marketing teams analyzing customer demographics, HR departments reviewing organizational composition, sales teams comparing performance metrics, executive reports on market analysis, and academic presentations of statistical data. Particularly effective for binary category comparisons such as gender, region, age group, or product preference analysis.
-
Slide Structure
2-slide deck with the first slide emphasizing green bars and the second highlighting yellow bars for visual variety. Each slide features 5 horizontal bars on the left (female data) and 5 on the right (male data) in symmetrical arrangement, with business character illustrations centered between them. 16:9 widescreen format optimized for modern presentation environments.
Related Products
-

Two-way Chart of Male and Female Surveys – Gender Comparison Visualization
#Market and Competitor Analysis #Graph #Customer Analysis
-

Statistics on People's Physical Fitness in Bar Chart – Insights Aimed at Competitive Advantage
#Market and Competitor Analysis #Graph #Other
-

Horizontal Bar Chart for Customer Analysis – Highlighting Competitive Advantage
#Market and Competitor Analysis #Graph #Customer Analysis
-

Customer Analysis Double Bar Graph – Effective Market Analysis
#Market and Competitor Analysis #Graph #Customer Analysis
