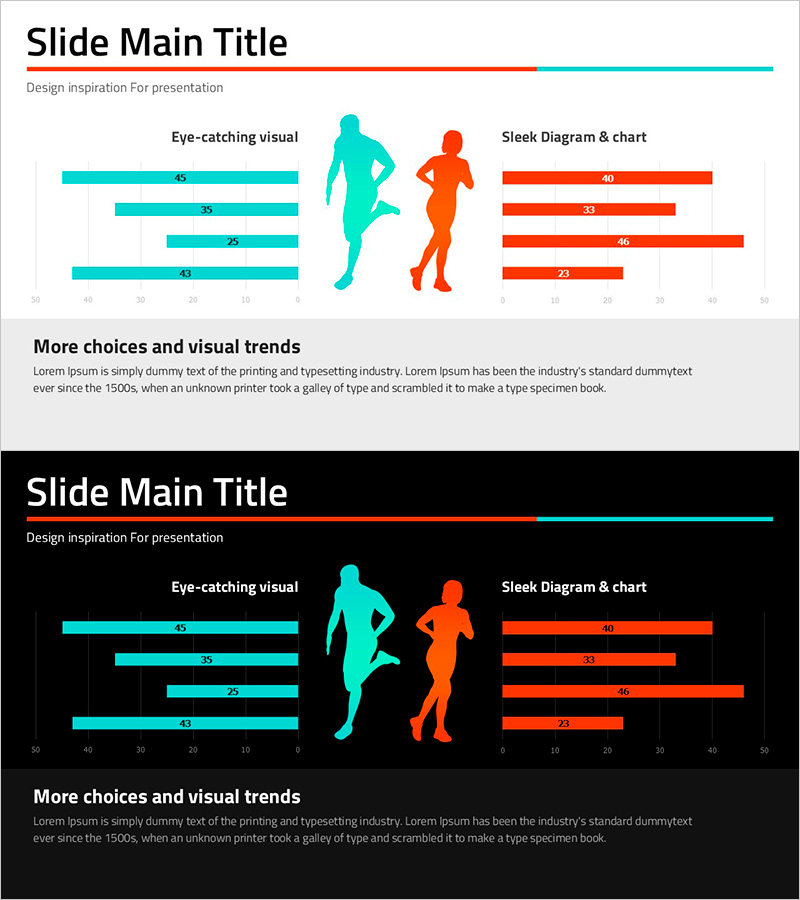
Statistics on People's Physical Fitness in Bar Chart – Insights Aimed at Competitive Advantage
RJ0800021_21
- Last Update 08/05/2025
- File Size 0.2MB
- # of Slides 2
- File Format PPTX
- Slide Ratio 16:9
- Color
Keywords
- #Content-Based Slides
- #Design-Based Slides
- #Market and Competitor Analysis
- #Graph
- #Other
- #Customer Analysis
- #Competitive Advantage
- #Horizontal Bar
- #Double Horizontal Bar
- #16:9
- #horizontal bar chart PowerPoint
- #data comparison slide template
- #4-item bar graph
- #market analysis PowerPoint slide
- #how to create bar chart in PowerPoint
About the Product
A horizontal bar chart PowerPoint slide for analyzing national physical fitness data with four items. Two data series are displayed side-by-side in contrasting teal and orange colors, enabling intuitive item-by-item numerical comparison. This 2-slide PPTX template in 16:9 format is ready for immediate editing and can be used in business presentations for market analysis, customer segmentation, and competitive positioning. Bar lengths clearly visualize numerical differences, while labels and values enhance information clarity in your presentation slides.
Usage Points
-
Main Usage
Optimized for comparing numerical data across items and identifying ranking and magnitude differences at a glance. Effectively communicates quantitative information such as national fitness statistics, market share, customer satisfaction scores, and competitive analysis.
-
How to Use
Insert into the market analysis or customer analysis sections of business reports, marketing plans, and investment proposals to emphasize data-driven insights. Use bar length and color contrast to highlight key figures, and customize labels to match your specific data.
-
Recommended For
Marketing professionals, planners, analysts, and executives use this slide to deliver data-driven decision-making persuasively. Ideal for visualizing market research results, customer segmentation analysis, competitive advantage assessment, and performance comparisons.
-
Slide Structure
Comprises 2 slides, each featuring a horizontal bar chart with 4 items. Two bar series in teal and orange are positioned side-by-side for each item, facilitating comparative analysis. Layout is optimized for 16:9 widescreen format.
Related Products
-

Travel Business Target Market and Customer Analysis Slide
#Market and Competitor Analysis #Graph #Other
-

Horizontal Bar Chart for Customer Analysis – Highlighting Competitive Advantage
#Market and Competitor Analysis #Graph #Customer Analysis
-

Gender Surgery Comparison Analysis Graph – Understanding Markets and Competitive Edge
#Market and Competitor Analysis #Graph #Other
-

Gender Ratio Analysis Bar Graph – Customer Analysis and Competitive Advantage
#Market and Competitor Analysis #Graph #Customer Analysis
