Competitor Analysis Bar Graph – Check Market Advantage
RJ0300062_25
- Last Update 05/05/2025
- File Size 0.1MB
- # of Slides 2
- File Format PPTX
- Slide Ratio 16:9
- Color
Keywords
- #Content-Based Slides
- #Design-Based Slides
- #Market and Competitor Analysis
- #Graph
- #Competitor Analysis
- #Competitive Advantage
- #Horizontal Bar
- #Double Horizontal Bar
- #16:9
- #competitor analysis chart
- #horizontal bar graph PowerPoint
- #market analysis presentation
- #competitive advantage slide
- #5-item comparison template
About the Product
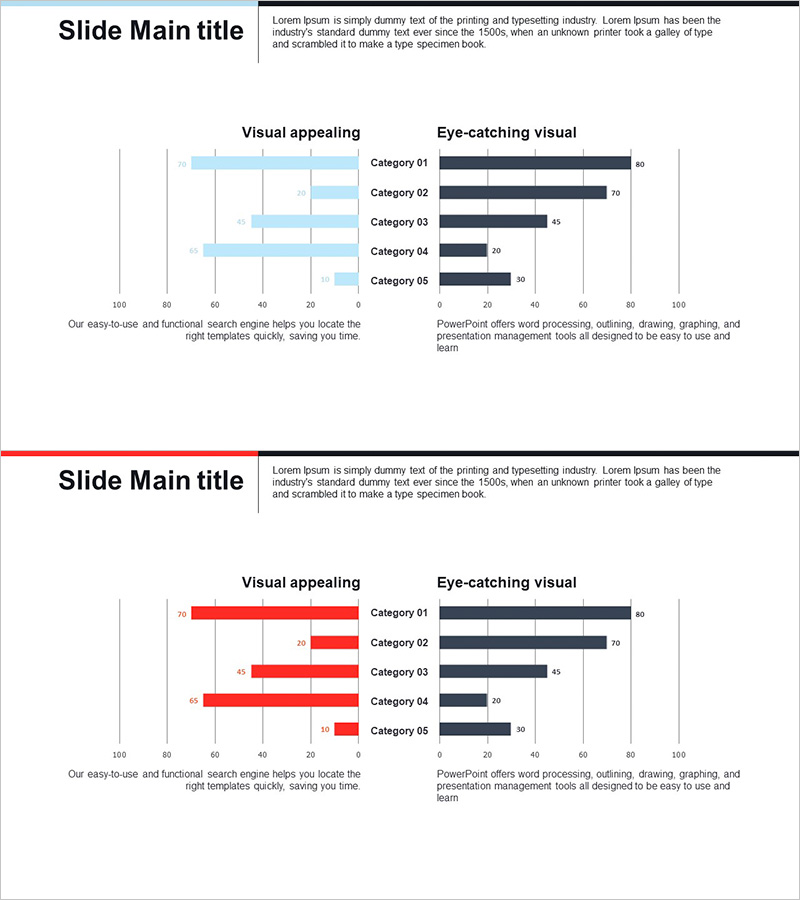
A horizontal bar graph PowerPoint slide designed for competitor analysis and market advantage assessment. This presentation template features a light blue and dark navy two-tone color scheme that visually compares five categories of competitive data. Delivered in 16:9 widescreen PPTX format, each slide combines text descriptions with data visualization to clearly communicate competitive positioning. Ideal for marketing strategy presentations, business reports, investor pitches, and competitive analysis meetings where immediate deployment is required.
Usage Points
-
Main Usage
This slide enables data-driven comparison of your company's strengths and weaknesses against competitors. It effectively communicates competitive positioning to investors and stakeholders during market strategy development and business planning phases.
-
How to Use
Edit category labels and numerical values with your competitive data. Light blue bars represent your company metrics while dark navy bars show competitor data, creating instant visual comparison. Insert into business reports, marketing plans, and investor presentations for immediate use.
-
Recommended For
Marketing managers, strategy planners, executives, and business development teams presenting competitive analysis findings. Particularly valuable for new market entry, product launches, and investment pitches where data-backed competitive positioning strengthens decision-making credibility.
-
Slide Structure
Two-slide layout with identical five-category structure. First slide displays light blue horizontal bars; second slide shows dark navy bars for direct comparison. Each bar includes numerical labels at the end, with category names (Category 01–05) on the left and values on the right for quick visual analysis.
Related Products
-

Competitive Advantage 3D Bi-directional Bar Graph – Essential Tool for Market Analysis
#Market and Competitor Analysis #Graph #Competitor Analysis
-

Competitor Analysis Double Bar Graph – Visualizing Competitive Advantage
#Market and Competitor Analysis #Graph #Competitor Analysis
-

Competitor Product Analysis and Competitive Advantage Bar Chart – Market Share Comparison
#Market and Competitor Analysis #Graph #Competitor Analysis
-

Comparative Analysis of Sales of Camping Competitors – Insights and Comparisons
#Market and Competitor Analysis #Graph #Competitor Analysis
