Utilization Rate of Oriental Medicine Clinics by Age – Market and Competitor Analysis
RJ0800050_15
- Last Update 08/14/2025
- File Size 0.4MB
- # of Slides 2
- File Format PPTX
- Slide Ratio 16:9
- Color
Keywords
- #Content-Based Slides
- #Design-Based Slides
- #Business Strategy
- #Market and Competitor Analysis
- #Graph
- #Financial Outlook & Expected Impact
- #Future Outlook
- #Column
- #Column Chart
- #16:9
- #horizontal bar chart PowerPoint
- #age group analysis slides
- #market research presentation
- #comparison chart template
- #demographic data visualization
About the Product
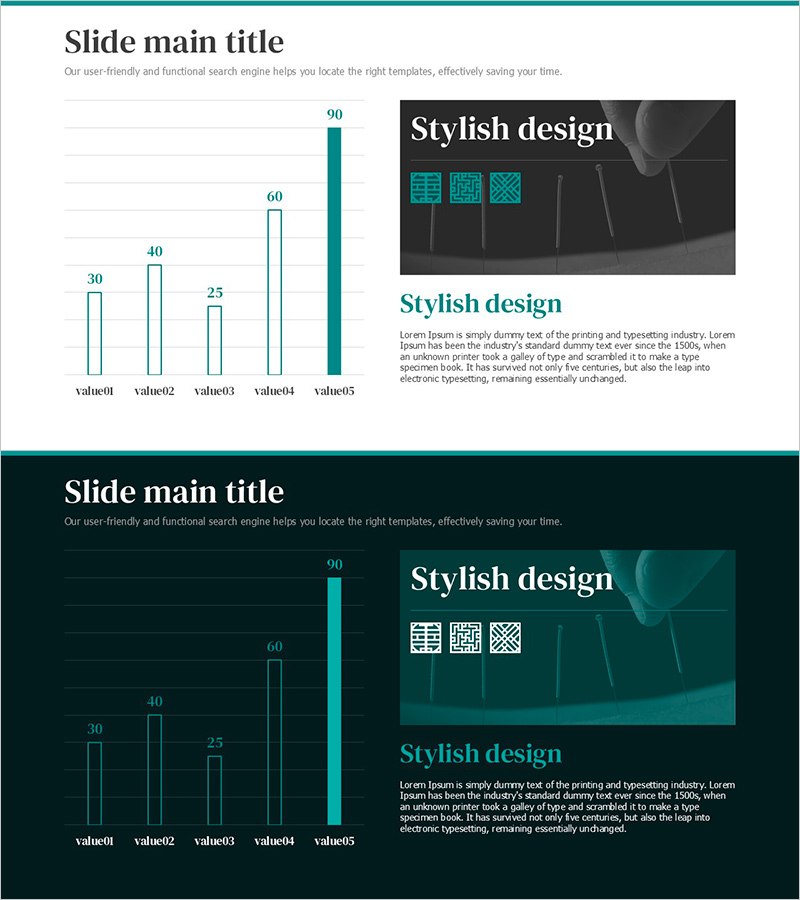
A horizontal bar chart PowerPoint slide comparing utilization rates across five age groups with clear data visualization. The design features teal-colored primary bars and light gray comparison bars on a bright background, making numerical differences immediately apparent. This presentation template is ready to use for market research, competitor analysis, and revenue forecasting in business presentations. The 2-slide set includes both light and dark background versions, allowing you to match your presentation theme and venue requirements. Ideal for demographic data visualization and audience segmentation analysis.
Usage Points
-
Main Usage
Effectively communicate demographic data and age-based utilization rates through clear numerical comparison, enabling stakeholders to understand market size, customer segment analysis, and competitive performance. The bar length provides intuitive visual comparison for data-driven decision making.
-
How to Use
Apply this slide in market research reports for customer demographic analysis, business plans for target audience segmentation, investment pitch decks for market size explanation, and competitive analysis presentations comparing age-based market share or adoption rates. Easily customize text labels to adapt the chart for various categorical data.
-
Recommended For
Marketing professionals, market research analysts, business strategists, investment relations managers, and healthcare organization executives presenting customer demographics and market conditions. Suitable for any business presentation requiring quantitative data visualization and audience segmentation analysis.
-
Slide Structure
Five-item horizontal bar chart with dual data series: teal primary bars and light gray comparison bars for each category (value01 through value05). Layout includes title and descriptive text area at top, with 'Stylish design' section featuring reference image and supporting text positioned on the right side.
Related Products
-

Soccer Illustration and Vertical Bar Graph – Market Analysis and Business Strategy Product
#Business Strategy #Market and Competitor Analysis #Graph
-

Growth Prospects Graph – Business Strategy Development
#Business Strategy #Market and Competitor Analysis #Graph
-

Donation Participation Rate Graph – Business Strategy and Future Outlook
#Business Strategy #Market and Competitor Analysis #Graph
-

Denim PPT Vertical Bar Graph Analysis – Market and Competitor Analysis
#Business Strategy #Market and Competitor Analysis #Graph
