Learning Future Outlook Vertical Bar Graph – Market Analysis and Expected Effects
RJ0500009_7
- Last Update 06/09/2025
- File Size 0.3MB
- # of Slides 2
- File Format PPTX
- Slide Ratio 16:9
- Color
Keywords
- #Content-Based Slides
- #Design-Based Slides
- #Business Strategy
- #Market and Competitor Analysis
- #Graph
- #Financial Outlook & Expected Impact
- #Future Outlook
- #Column
- #Column Chart
- #16:9
- #vertical bar chart PowerPoint
- #bar graph slide template
- #data comparison chart
- #numerical visualization PPT
- #market analysis graph PowerPoint
About the Product
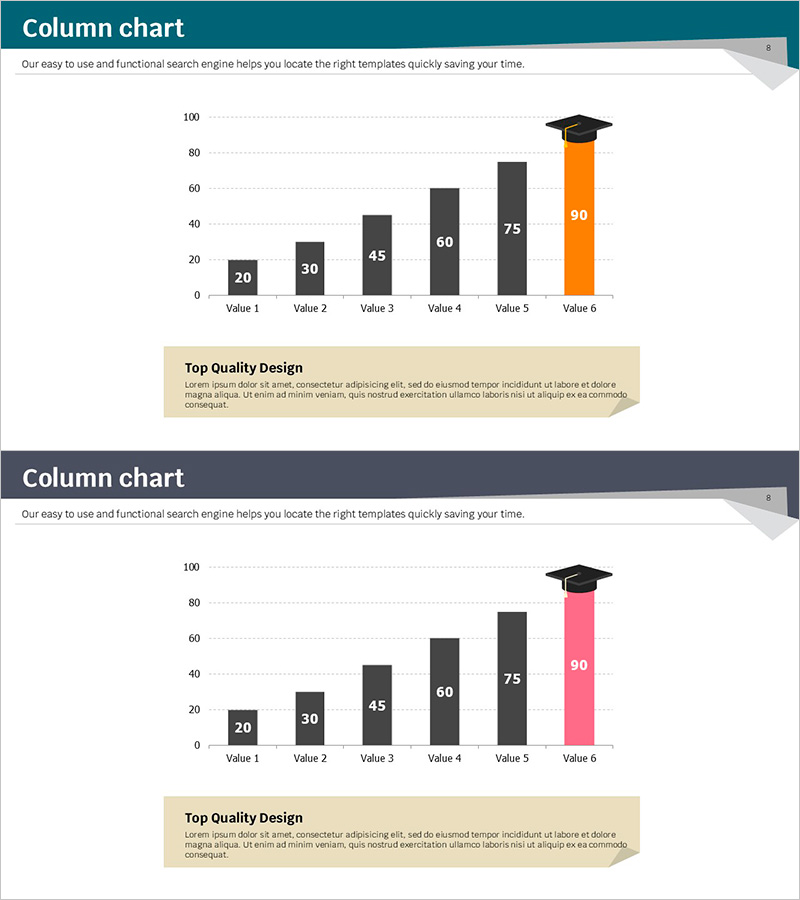
A vertical bar chart PowerPoint slide visualizing learning future outlook with six data points. The design features dark gray baseline bars contrasted with orange and pink accent bars, each labeled with clear numerical values. This presentation template effectively communicates quantitative data for market analysis, revenue forecasting, performance comparison, and growth metrics. Available in 16:9 widescreen PPTX format, fully editable and ready to customize with your own data.
Usage Points
-
Main Usage
Visualizes step-by-step comparison and trend analysis of quantitative data. The six-bar structure allows intuitive comparison of metrics such as learning outcomes, market size, revenue trends, and growth rates, with orange and pink accent bars highlighting key data points.
-
How to Use
Insert this slide into business reports, marketing plans, and investor presentations within the analysis section. Modify bar heights and colors to match your data, update labels with category names and values, and adjust background and bar colors to align with corporate branding guidelines.
-
Recommended For
Financial analysts, marketing managers, executives, consultants, and educators who need to present quantitative data persuasively. Ideal for quarterly performance reviews, competitive benchmarking, learning outcome assessments, and comparative analysis presentations.
-
Slide Structure
Two-slide layout featuring a vertical bar chart with six data categories. The first slide displays orange accent bars, while the second slide shows the same structure with pink accent bars. Both slides include a 'Top Quality Design' text box at the bottom for additional commentary or explanations.
Related Products
-

Future Outlook Vertical Bar Graph – Business Strategy Analysis
#Business Strategy #Market and Competitor Analysis #Graph
-

Growth Prospects Graph – Business Strategy Development
#Business Strategy #Market and Competitor Analysis #Graph
-

Soccer Illustration and Vertical Bar Graph – Market Analysis and Business Strategy Product
#Business Strategy #Market and Competitor Analysis #Graph
-

Donation Participation Rate Graph – Business Strategy and Future Outlook
#Business Strategy #Market and Competitor Analysis #Graph
