Modern Business Presentation Template Line Chart
RJ0200028_15
- Last Update 04/05/2025
- File Size 6.9MB
- # of Slides 2
- File Format PPTX
- Slide Ratio 16:9
- Color
Keywords
- #Content-Based Slides
- #Design-Based Slides
- #Business Strategy
- #Market and Competitor Analysis
- #Graph
- #Other
- #Industry Trends
- #Line
- #Line Chart
- #Silhouette
- #Project Progress
- #16:9
- #line chart PowerPoint
- #trend comparison slide
- #dual-series chart template
- #business performance PPT
- #executive report graph
About the Product
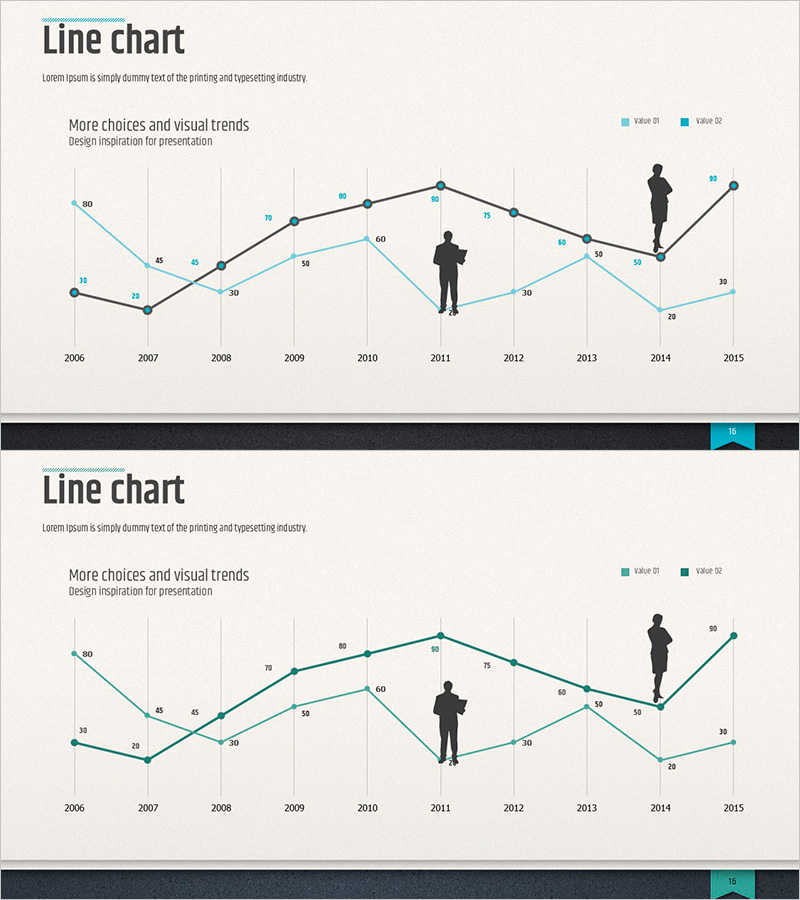
A professional line chart PowerPoint slide comparing two data series across a 10-year period from 2006 to 2015. The design features light blue and dark navy trend lines that intersect to show rising and falling patterns, with numeric labels at each data point for precise value comparison. A business professional silhouette is positioned at the center of the slide, making it ideal for executive presentations, business performance analysis, and strategic reporting. This 2-slide set in 16:9 widescreen format allows full customization of colors, data values, and text content.
Usage Points
-
Main Usage
Visualize numerical changes over time by comparing two or more data series across years, quarters, or months. Effectively communicate key performance indicators such as revenue growth, customer acquisition, market share, and competitive benchmarking to executives, investors, and stakeholders with clear visual insights.
-
How to Use
Deploy in quarterly business reviews, executive presentations, investor pitch decks, market analysis reports, and annual performance summaries. The central business professional silhouette reinforces themes of leadership and growth. Customize the color scheme, axis ranges, and data values to match your specific metrics. The dual-series design accommodates side-by-side comparisons of internal performance versus market trends or competitor data.
-
Recommended For
Executives, CFOs, business analysts, marketing managers, consultants, and strategy teams presenting performance metrics, competitive analysis, and market trends. Ideal for quarterly earnings reports, investor relations presentations, business plan performance sections, and marketing strategy market analysis segments.
-
Slide Structure
2-slide set featuring dual-series line charts with light blue and dark navy trend lines tracking 10 data points (2006–2015). Each point displays numeric labels for precise value reference. Includes legend, axis labels, and title area. A business professional silhouette serves as a visual anchor at the center. Formatted in 16:9 widescreen for optimal display on modern projectors and monitors.
Related Products
-

Competitor Analysis Broken Line Graph – Visualizing Market Trends
#Market and Competitor Analysis #Graph #Other
-

Leather Material Presentation Template Line Chart – Business Strategy
#Business Strategy #Market and Competitor Analysis #Graph
-

Market Trend Analysis Graph – Sleek and Stylish Design
#Market and Competitor Analysis #Diagram #Graph
-

Line Graph of Sugar Intake by Year – Market Trends and Future
#Company Introduction #Market and Competitor Analysis #Graph
