Leather Material Presentation Template Line Chart – Business Strategy
RJ0200021_6
- Last Update 04/03/2025
- File Size 6.2MB
- # of Slides 2
- File Format PPTX
- Slide Ratio 16:9
- Color
Keywords
- #Content-Based Slides
- #Design-Based Slides
- #Business Strategy
- #Market and Competitor Analysis
- #Graph
- #Industry Trends
- #Line
- #Line Chart
- #Project Progress
- #16:9
- #line chart PowerPoint slide
- #dual-series trend comparison
- #business strategy presentation
- #market trend visualization
- #data comparison slide template
- #how to create line chart in PowerPoint
About the Product
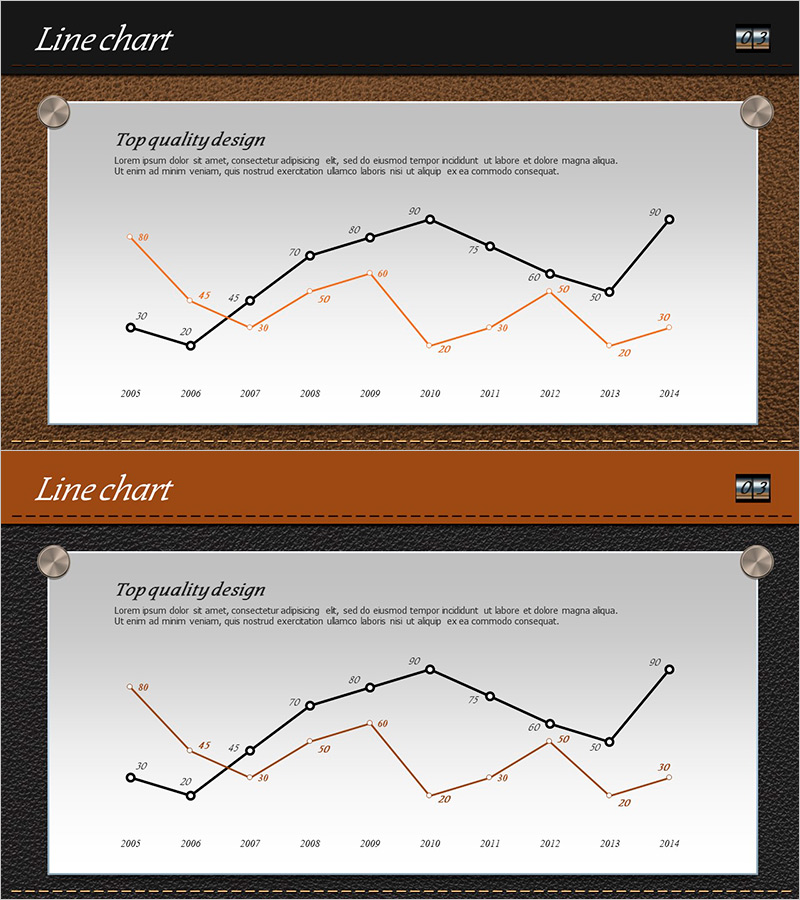
A professional dual-series line chart PowerPoint slide designed for business strategy and market trend presentations. The slide features black and orange trend lines tracking data from 2005 to 2014, enabling clear comparison of two independent metrics over a 10-year period. The leather texture background with metallic pin accents adds premium credibility to executive presentations. Each data point is labeled with precise values, making it ideal for competitive analysis, growth rate visualization, business performance tracking, and market dynamics reporting. The slide deck is fully editable and ready for immediate use in corporate presentations.
Usage Points
-
Main Usage
This slide excels at visualizing business progress and market trends across time periods while comparing two independent data sets simultaneously. It effectively communicates competitive positioning, forecast versus actual performance, or the correlation between two key business metrics in a clear, professional manner.
-
How to Use
Deploy this slide in executive briefings, quarterly business reviews, investor pitch decks, and strategic planning presentations where trend analysis is critical. Simply replace the sample data points with your actual figures, and customize the line colors and background to match your corporate branding. The layout supports immediate presentation without additional design work.
-
Recommended For
CFOs, financial analysts, marketing strategists, business development managers, management consultants, and data analysts who need to present quantitative performance metrics and market shifts with credibility. Particularly effective for long-term trend analysis and comparative performance reporting.
-
Slide Structure
Two-slide set featuring dual-series line charts. First slide emphasizes black trend line (primary metric, 2005–2014), second slide highlights orange trend line (comparative metric). Both slides include title area, legend, 10 labeled data points with values, and consistent leather texture framing with metallic pin design elements for unified premium presentation.
Related Products
-

Modern Business Presentation Template Line Chart
#Business Strategy #Market and Competitor Analysis #Graph
-

Visualizing Project Progress and Future Prospects – Journey to Success
#Business Strategy #Market and Competitor Analysis #Graph
-

Mid-to-Long Term Vision & Growth Strategy Roadmap – Business Advancement Timeline
#Business Strategy #Diagram #Graph
-

Navigation App Market Trends and Outlook
#Market and Competitor Analysis #Graph #Future Outlook
