Business Plan Presentation Template – Bar Diagram for Competitive Advantage Analysis
RJ0200027_7
- Last Update 04/05/2025
- File Size 1.5MB
- # of Slides 2
- File Format PPTX
- Slide Ratio 16:9
- Color
Keywords
About the Product
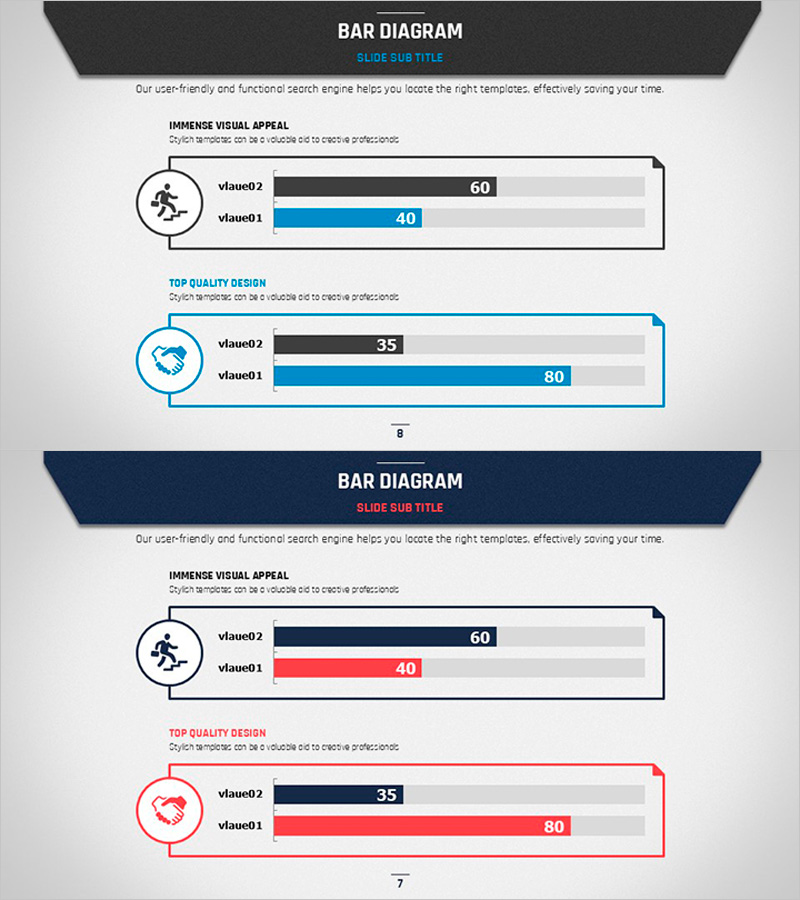
A horizontal bar chart PowerPoint slide designed for business planning and competitive advantage analysis. This template features two data series displayed side-by-side, with icons and text labels to enhance information clarity. Available in both blue and red color themes, each slide is formatted in 16:9 widescreen PPTX for immediate editing. Perfect for market analysis, competitor comparison, performance metrics visualization, and strategic presentations.
Usage Points
-
Main Usage
Displays two data series side-by-side in horizontal orientation for intuitive numerical comparison and ranking analysis. Optimized for competitive performance benchmarking, market share analysis, target vs. actual evaluation, and strategic business decision-making presentations.
-
How to Use
Double-click text and values within the slide to edit directly; bar lengths adjust automatically. Left-side icons represent categories, while right-side labels accommodate precise numerical input. Color themes can be modified via the Design tab for customization.
-
Recommended For
Ideal for executives, planning teams, marketing departments, and sales teams presenting quarterly performance reports, competitive analysis findings, and market research results. Particularly effective in strategy meetings and investor presentations where quantitative data comparison builds credibility.
-
Slide Structure
2-slide set. First slide features blue theme with 2 data series (value01 & value02) display; second slide provides identical structure in red theme. Each slide comprises left circular icon, center horizontal bars (2 series), and right numerical labels for complete data representation.
Related Products
-

Bar Chart Analysis of Gardening Activities Trend – Performance and Competitive Advantage
#Business Strategy #Market and Competitor Analysis #Diagram
-

Red Blue Area Chart – Market and Competitor Analysis
#Market and Competitor Analysis #Graph #Competitor Analysis
-

India Travel-Related Business Overview and Market Share – Market Status Analysis
#Market and Competitor Analysis #Graph #Market Status
-

Customer Analysis Visualization with Horizontal Bar Chart
#Market and Competitor Analysis #Graph #Customer Analysis
