Fire Dispatch Graph – Market Analysis and Competitive Advantage
RJ0800019_8
- Last Update 08/05/2025
- File Size 4.8MB
- # of Slides 2
- File Format PPTX
- Slide Ratio 16:9
- Color
Keywords
- #Content-Based Slides
- #Design-Based Slides
- #Market and Competitor Analysis
- #Graph
- #Market Analysis
- #Competitive Advantage
- #Horizontal Bar
- #Horizontal Bar Chart
- #16:9
- #horizontal bar chart PowerPoint
- #bar graph slide template
- #comparison analysis chart
- #data visualization PowerPoint
- #how to create bar chart in PowerPoint
About the Product
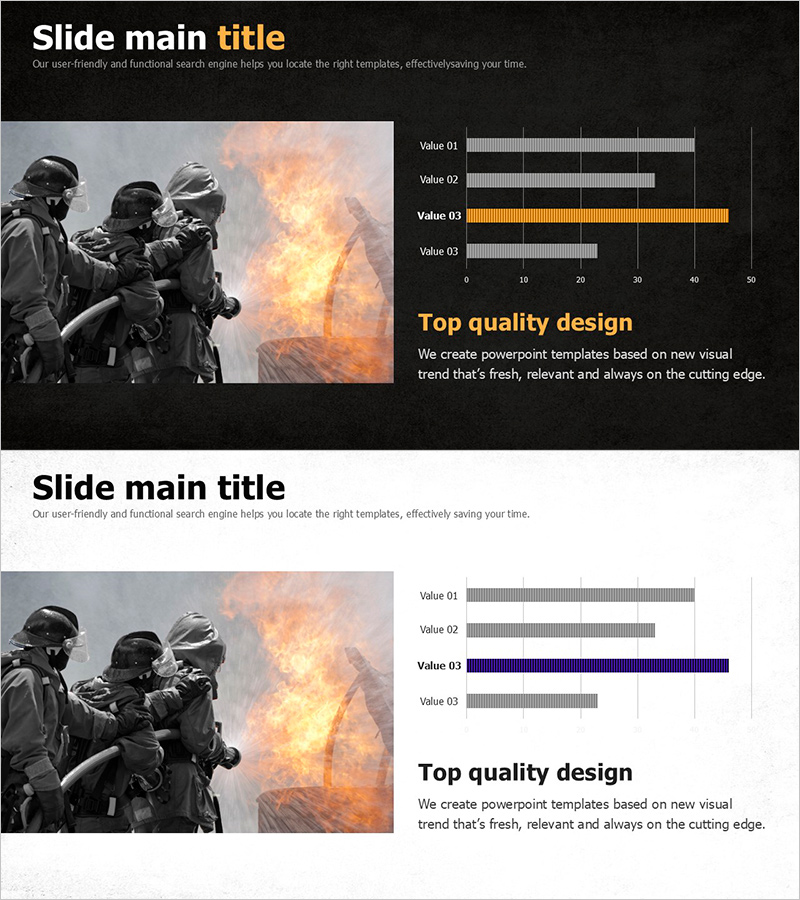
A horizontal bar chart PowerPoint slide designed for market analysis and competitive advantage visualization. This presentation template displays four data items in comparative format using gray and orange color differentiation, with a 0–50 scale for clear quantitative representation. Ideal for business presentations including fire dispatch statistics, market share analysis, competitor benchmarking, and performance metrics. The 2-slide set includes both dark and light background versions, allowing you to match your presentation tone and audience context.
Usage Points
-
Main Usage
This chart excels at comparing quantitative data across multiple items and displaying relative rankings. Use it to present market analysis, competitor comparison, sales performance, customer satisfaction scores, and other metrics where 4+ items need side-by-side evaluation.
-
How to Use
Deploy this slide in the analysis section of business presentations to explain market conditions, competitive landscape, and key performance indicators. The dark background version works well for impactful opening slides and core message emphasis, while the light version suits detailed analytical pages.
-
Recommended For
Marketing professionals, executives, management consultants, and sales teams presenting market research findings and competitive advantages. Highly applicable in business plans, investor pitch decks, marketing strategy presentations, and quarterly performance reports.
-
Slide Structure
Four data items (Value 01–04) are represented as horizontal bars scaled from 0 to 50. Orange accent bars distinguish highlighted items from gray baseline bars, enabling emphasis on specific competitive strengths. Grid lines support precise numerical reading and data accuracy.
Related Products
-

Scientific Research Results Graph – A Tool for Market Analysis and Competitive Advantage
#Market and Competitor Analysis #Graph #Market Analysis
-

Competitor Analysis Area Graph – Visualizing Market Status
#Market and Competitor Analysis #Graph #Market Analysis
-

Illustration Brush Graph Analysis Slide
#Market and Competitor Analysis #Graph #Market Analysis
-

Bar Chart for Vegetable Intake Survey
#Market and Competitor Analysis #Graph #Market Analysis
