Business Plan Presentation Template – Line Diagram for Market Analysis
RJ0200027_19
- Last Update 04/05/2025
- File Size 2.9MB
- # of Slides 2
- File Format PPTX
- Slide Ratio 16:9
- Color
Keywords
About the Product
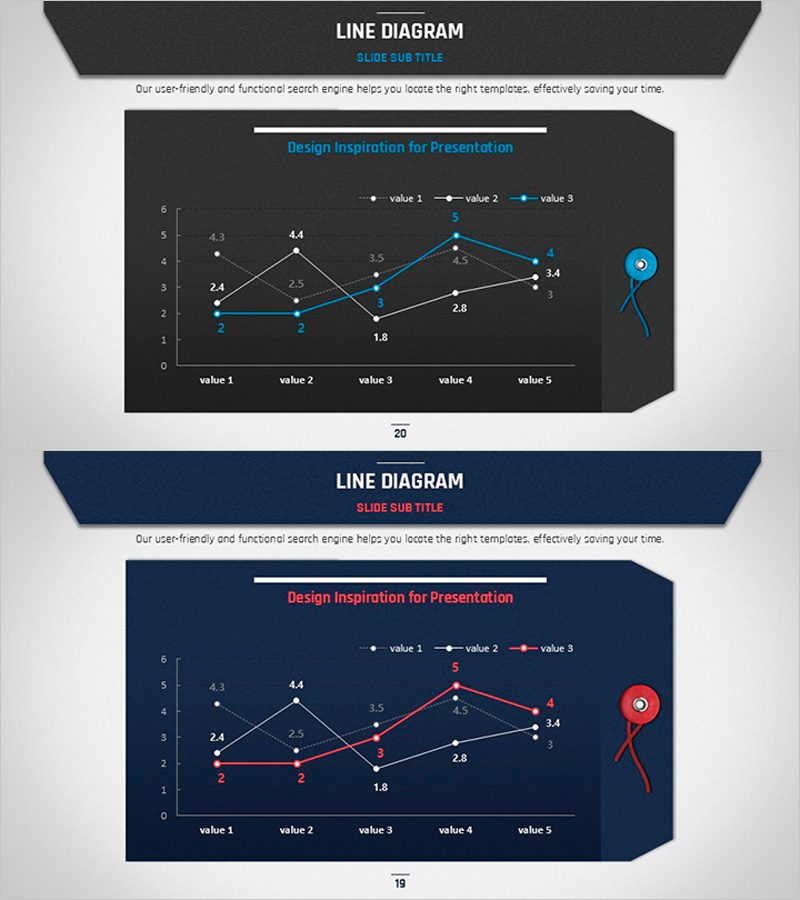
A multi-series line chart PowerPoint slide that visualizes business performance trends with clarity and precision. Three data series—white, cyan, and red—are plotted across five data points on a dark background, making temporal changes and comparative patterns immediately apparent. Each series includes labeled values and a legend for quick reference, ideal for market analysis, competitive benchmarking, and performance reporting. The 16:9 widescreen format includes 2 slides with fully editable colors, data values, and labels for seamless integration into your presentation.
Usage Points
-
Main Usage
Designed to compare multiple metrics over time, this slide enables simultaneous visualization of several data series—such as revenue, customer satisfaction, and market share—revealing correlations and trend patterns at a glance. Ideal for demonstrating performance trajectories and competitive positioning.
-
How to Use
Use in quarterly business reviews, market analysis presentations, competitive intelligence reports, marketing performance dashboards, and investor updates. The high-contrast dark background ensures clarity in projector environments and digital displays, making data trends unmistakable to your audience.
-
Recommended For
Executives, marketing managers, sales leaders, data analysts, and management consultants benefit most from this template. Perfect for strategy meetings, investor presentations, performance reviews, and any data-driven decision-making scenario where quantitative evidence is paramount.
-
Slide Structure
Two slides with dark backgrounds (charcoal and navy) featuring three line series (white, cyan, red) across five labeled data points. Includes legend, axis labels, and value annotations. All elements are fully editable—simply update data values and customize colors to match your brand guidelines.
Related Products
-

Gradient Theme Broken Line Graph – Market Analysis and Competitive Edge
#Market and Competitor Analysis #Graph #Competitor Analysis
-

Business Competitor Analysis Graph
#Market and Competitor Analysis #Graph #Competitor Analysis
-

Competitor Analysis Broken Line Graph – Market Dominance and Competitive Advantage
#Market and Competitor Analysis #Graph #Competitor Analysis
-

Simple Cement Theme Broken Line Graph – Market and Competitor Analysis
#Market and Competitor Analysis #Graph #Competitor Analysis
