Competitor Product Competitive Advantage Analysis Graph – Market Trends Visualization
RJ0400042_9
- Last Update 08/30/2025
- File Size 0.2MB
- # of Slides 2
- File Format PPTX
- Slide Ratio 16:9
- Color
Keywords
- #Content-Based Slides
- #Design-Based Slides
- #Market and Competitor Analysis
- #Graph
- #Competitor Analysis
- #Competitive Advantage
- #Line
- #Line Chart
- #16:9
- #line chart PowerPoint
- #market trend analysis slide
- #competitive analysis presentation
- #dual-series line graph
- #trend visualization PPT
- #business comparison chart PowerPoint template
About the Product
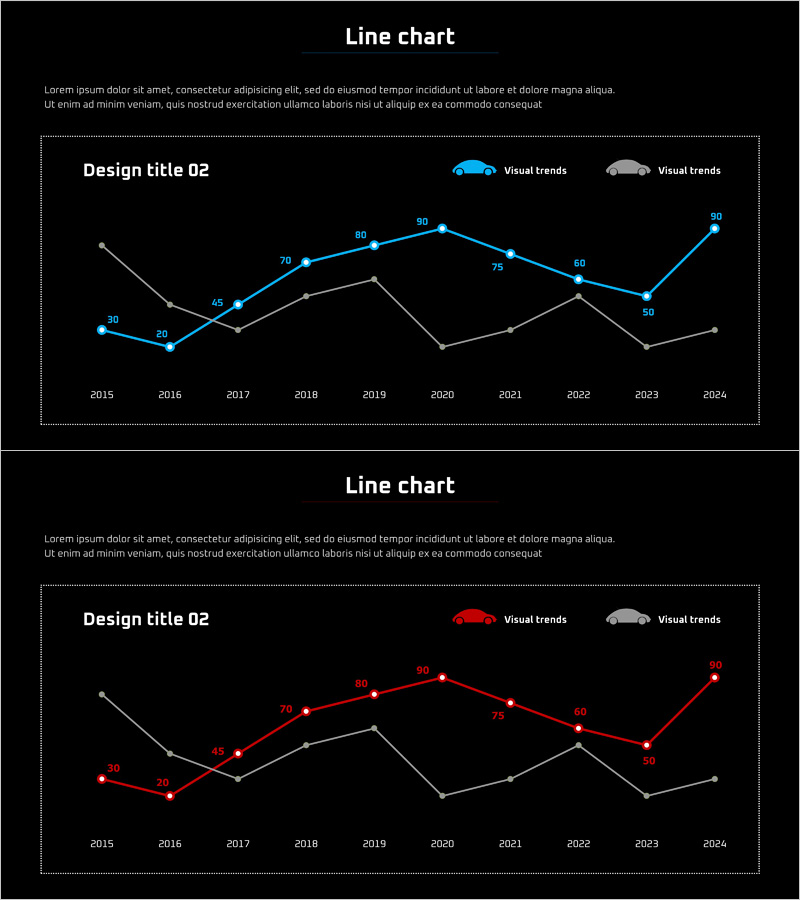
A dual-series line chart PowerPoint slide designed for competitive product analysis and market trend visualization. Set against a dark background, the slide displays two data series in blue and gray lines tracking market performance from 2015 to 2024. Each data point is labeled with numerical values to clearly show trend changes and growth rate differences. The legend with icons distinguishes between the two series, making it ideal for competitive analysis sections in business presentations and reports. The 2-slide set provides the same structure with varied color combinations for flexibility.
Usage Points
-
Main Usage
Compare competitor product performance against your own across a 10-year timeline using two distinct data series. The line chart format clearly illustrates performance trends, growth trajectories, and competitive positioning in the market.
-
How to Use
Insert into business reports, investor pitch decks, and marketing strategy presentations in the competitive analysis section. Customize the legend icons and labels with your company and competitor names, then update data point values with actual performance metrics.
-
Recommended For
Strategy planners, marketing managers, business development executives, and investor relations professionals preparing competitive analysis materials. Suitable for market research reports, quarterly performance reviews, and new product launch strategy presentations.
-
Slide Structure
Dark background slide with title area, legend showing two series with icons and labels, and line chart visualization. X-axis displays years 2015–2024, Y-axis shows numerical scale. Two lines (blue and gray) intersect and diverge throughout the timeline. Each data point includes a numerical label for precise value comparison.
Related Products
-

Visualizing Menu Sales Status with Line Chart
#Market and Competitor Analysis #Graph #Competitor Analysis
-

Blue Green Broken Line Graph – Competitor Analysis
#Market and Competitor Analysis #Graph #Competitor Analysis
-

Competitor Idea Analysis Graph
#Market and Competitor Analysis #Graph #Competitor Analysis
-

Modern Theme Competitor Analysis Graph
#Market and Competitor Analysis #Graph #Competitor Analysis
