Blue Orange Vertical Bar Chart – Emphasizing Creativity
RJ0600062_6
- Last Update 07/06/2025
- File Size 3.4MB
- # of Slides 2
- File Format PPTX
- Slide Ratio 16:9
- Color
Keywords
About the Product
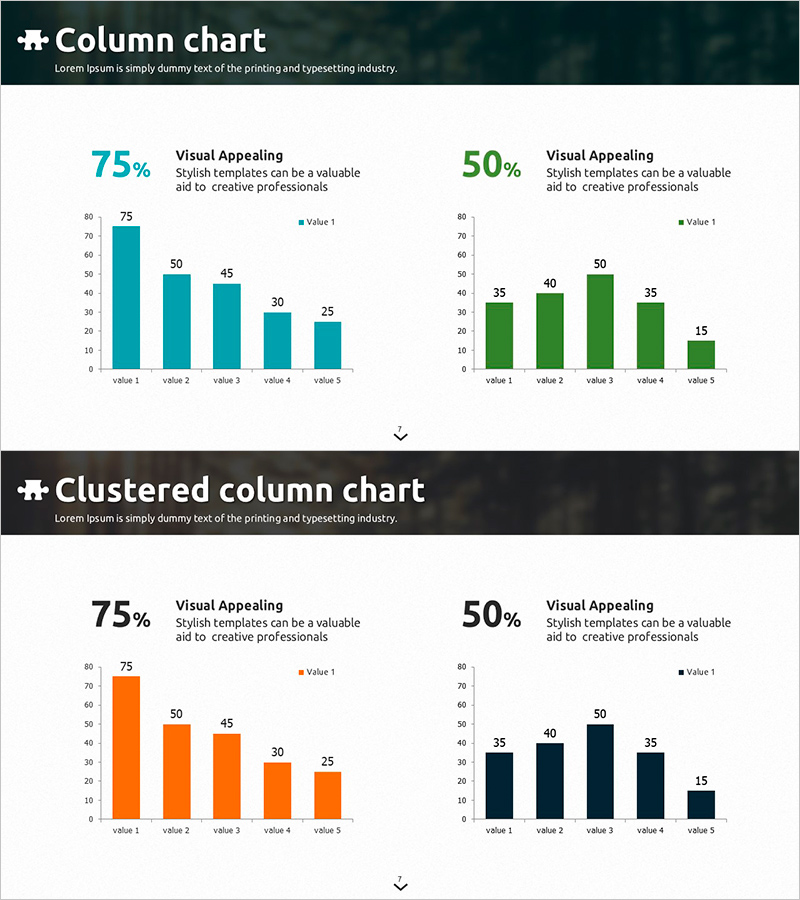
A vertical bar chart PowerPoint slide featuring teal and orange dual-tone color schemes across two slides. This presentation template displays five data items with clear numerical comparisons, ranging from a maximum value of 75 to a minimum of 15. Each slide applies different color combinations—teal, green, orange, and black—to provide visual variety in data representation. The 16:9 widescreen PPTX format is fully editable and ready for immediate use in business strategy presentations, performance analysis reports, and company overview decks. Percentage-emphasized text labels enhance visual impact and data clarity for stakeholder presentations.
Usage Points
-
Main Usage
Visually compares five data items using bar height representation, making quantitative information immediately understandable. The range from 75% to 15% clearly illustrates performance metrics, market share, quarterly results, and competitive analysis data for executive-level presentations.
-
How to Use
Apply this template to quarterly performance reports, competitive benchmarking slides, sales achievement comparisons, and key performance indicator dashboards. Simply replace the sample data and labels with your actual figures—the color-coded bars automatically highlight value differences for audience comprehension.
-
Recommended For
Finance and planning teams presenting quarterly results, sales departments comparing regional performance, management reporting to executives and investors, and business development teams analyzing market positioning. Suitable for any professional requiring data-driven, credibility-focused presentations.
-
Slide Structure
Two-slide set, each containing a five-item vertical bar chart. Slide 1 uses teal color scheme; Slide 2 combines green, orange, and black for visual variety. Each chart includes percentage labels (75%, 50%, etc.) and descriptive text ('Visual Appealing') positioned above bars. Formatted in 16:9 widescreen ratio for modern presentation environments.
Related Products
-

Visualizing Successful Business Performance with Horizontal Bar Chart
#Company Introduction #Business Strategy #Graph
-

Business Data Overview Slide - Performance Visualization
#Company Introduction #Business Strategy #Graph
-

Vertical Bar Chart for Achieving Goals – Growth and Fulfillment
#Business Strategy #Graph #Financial Outlook & Expected Impact
-

Analysis of Factors Contributing to Excellent Sales Performance – Visualizing Success
#Business Strategy #Financial Plans and Performance #Graph
