Green Company Overview – Visualizing Key Achievements
RJ0600088_4
- Last Update 07/14/2025
- File Size 4.4MB
- # of Slides 2
- File Format PPTX
- Slide Ratio 16:9
- Color
Keywords
- #Content-Based Slides
- #Design-Based Slides
- #Company Introduction
- #Diagram
- #Company Overview
- #Key Achievements
- #Cluster
- #Closed Cluster Diagram
- #16:9
- #company overview diagram PowerPoint
- #4-icon circular slide template
- #business achievement visualization
- #cluster diagram presentation
- #corporate profile slide design
About the Product
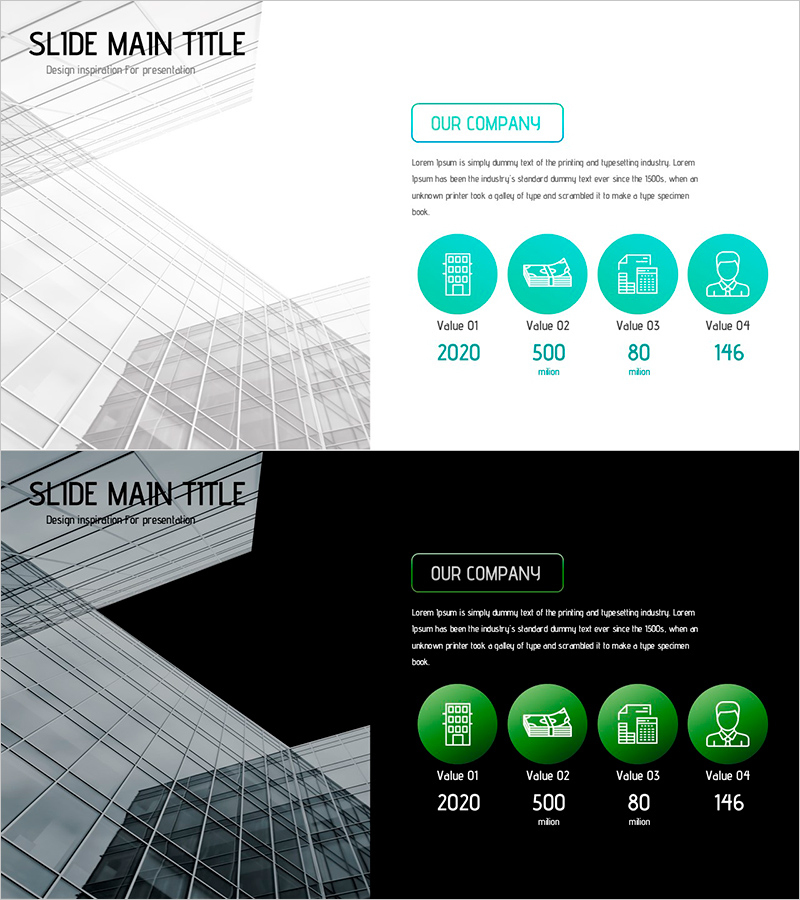
A PowerPoint slide template that visualizes your company's core values and key achievements using four circular icon nodes in turquoise-green tones. Each circle contains a distinct icon (building, investment, real estate, personnel) with numerical data displayed below (2020, 500 million, 80, 146). This design is ideal for company overview presentations, investor pitch decks, and corporate profile slides where you need to communicate organizational scale, financial performance, and business metrics at a glance. The 2-slide set includes both light and dark background versions, allowing you to adapt to different presentation environments and screen conditions.
Usage Points
-
Main Usage
Simultaneously present four critical business metrics—organizational size, revenue, market share, and personnel—through a clean circular node layout. The icon-based design makes complex data instantly comprehensible, while the color-coded nodes help distinguish different performance categories.
-
How to Use
Place this slide early in your company overview presentation to establish credibility and scale. Use it in investor pitch decks, corporate partnership proposals, recruitment presentations, and annual reports. Select the light background version for bright venues and the dark version for dimly lit conference rooms or projection screens.
-
Recommended For
C-suite executives, business development managers, investor relations professionals, and marketing teams presenting corporate performance. Particularly effective for finance, real estate, construction, manufacturing, and technology sectors where quantitative metrics drive decision-making.
-
Slide Structure
Two-slide template featuring light background (top) and dark background (bottom) versions. Each slide has a title area in the upper left and four turquoise circular nodes arranged horizontally on the right, with icons centered in each node and corresponding labels and numerical values positioned below.
Related Products
-

Company Overview and Performance Graph Slide Template – Performance Highlight
#Company Introduction #Diagram #Graph
-

Visually Representing Company Overview Slide – Trendy Design
#Company Introduction #Diagram #Company Overview
-

Key Achievements of the Building Project – The Keys to Success
#Company Introduction #Diagram #Company Overview
-

Company Overview of Eco-Friendly Enterprises PPT – Sustainable Vision
#Company Introduction #Diagram #Company Overview
