Company Overview and Performance Graph Slide Template – Performance Highlight
RJ0900019_4
- Last Update 08/21/2025
- File Size 0.5MB
- # of Slides 2
- File Format PPTX
- Slide Ratio 16:9
- Color
Keywords
- #Content-Based Slides
- #Design-Based Slides
- #Company Introduction
- #Diagram
- #Graph
- #Company Overview
- #Key Achievements
- #Cluster
- #Horizontal Bar
- #Closed Cluster Diagram
- #Horizontal Bar Chart
- #16:9
- #horizontal bar chart PowerPoint
- #performance comparison slide template
- #data visualization presentation
- #KPI chart template
- #business metrics PowerPoint slide
About the Product
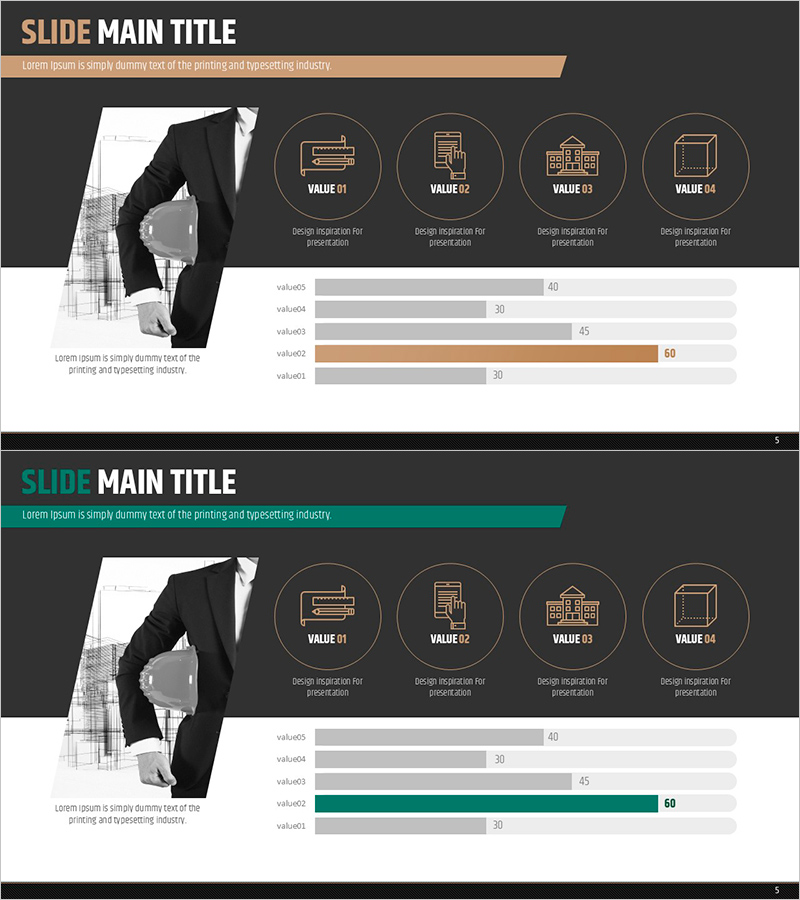
A professional horizontal bar chart PowerPoint slide designed to compare company performance and key metrics at a glance. The slide features a dark gray background with beige, terracotta, and gray-toned bars visualizing five data points, complemented by a business image on the left side to reinforce credibility. Ideal for company overview sections, performance reports, business plans, and investor presentations. The 2-slide deck in 16:9 aspect ratio (PPTX format) is ready for immediate use in corporate presentations and strategic communications.
Usage Points
-
Main Usage
This slide effectively communicates company performance metrics, departmental results, and key performance indicators (KPIs) through quantitative comparison. The horizontal bar format enables intuitive visual ranking and relative magnitude comparison, making it ideal for company overview, business performance, and marketing results sections where data-driven credibility is essential.
-
How to Use
Replace the left-side business image with your company logo or relevant photography. Update the bar labels and numerical values with your actual data, and customize the bar colors to match your corporate brand palette. Modify the title and descriptive text at the top to adapt the slide for different performance metrics and reporting scenarios.
-
Recommended For
Recommended for executive briefings, investor pitches, quarterly and annual performance reports, marketing team results presentations, and inter-departmental performance comparisons. Particularly effective for company overview documents, business plans, and investment pitch decks where quantitative data emphasis is critical.
-
Slide Structure
The 2-slide deck features a consistent layout with a left-side business image (professional businessman photo), four circular VALUE icons (01–04) in the upper right, and a 5-item horizontal bar chart (value01–value05, ranging from 30 to 60) in the lower right. Slide 1 uses beige accent color; Slide 2 uses terracotta accent color for visual variation.
Related Products
-

Company Overview and Growth Potential Analysis – Utilizing Diagrams and Graphs
#Company Introduction #Business Introduction #Business Vision and Strategy
-

Company Overview Summary Diagram - Intuitive and Sleek Design
#Company Introduction #Business Introduction #Business Vision and Strategy
-

Green Company Overview – Visualizing Key Achievements
#Company Introduction #Diagram #Company Overview
-

Company Overview of Eco-Friendly Enterprises PPT – Sustainable Vision
#Company Introduction #Diagram #Company Overview
