100% Stacked Column Chart Slide – Performance and Market Trends
RJ0200026_26
- Last Update 04/04/2025
- File Size 0.1MB
- # of Slides 2
- File Format PPTX
- Slide Ratio 16:9
- Color
Keywords
- #Content-Based Slides
- #Design-Based Slides
- #Business Strategy
- #Market and Competitor Analysis
- #Graph
- #Achievements
- #Industry Trends
- #Horizontal Bar
- #Segmented Horizontal Bar
- #16:9
- #100% stacked column chart PowerPoint
- #multi-series comparison slide
- #market trend chart template
- #performance analysis graph
- #stacked bar chart download
About the Product
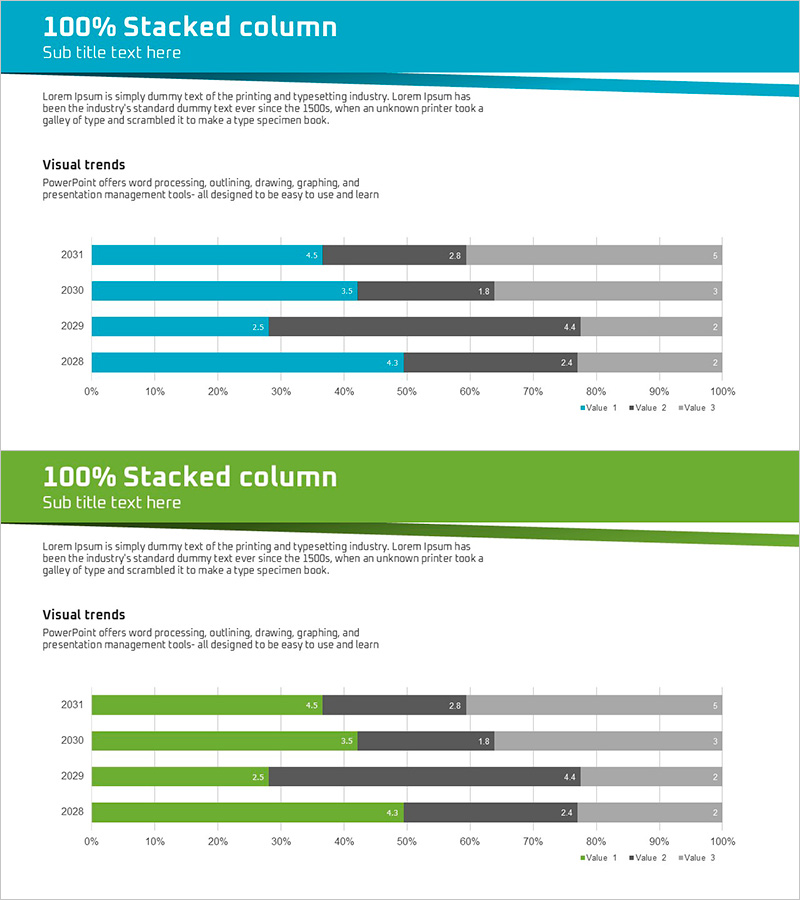
A horizontal 100% stacked bar chart PowerPoint slide designed to compare year-over-year performance metrics and market trends across four data series. The chart visualizes data from 2028 to 2031 using a blue, gray, and black color palette, clearly showing the proportional composition and annual shifts in each category. This slide deck is ideal for business strategy sections, competitive analysis, and market trend presentations where multi-dimensional ratio comparisons are essential. Delivered in 16:9 widescreen PPTX format with fully editable elements, data labels, and legend for immediate use in executive presentations.
Usage Points
-
Main Usage
This chart excels at displaying both the proportional composition and year-over-year changes of complex multi-series data. By dividing 100% across multiple categories, it enables simultaneous comparison of relative weights and temporal trends, making it ideal for market share analysis, revenue composition, resource allocation, and portfolio performance tracking.
-
How to Use
Insert this slide into the business strategy section to illustrate annual investment allocation patterns, or use it in competitive analysis to show market composition evolution. Simply double-click the data values to replace them with your own figures; the chart automatically recalculates proportions, allowing rapid updates across multiple datasets.
-
Recommended For
Recommended for business analysts, strategy planners, and marketing professionals preparing executive reports, business plans, investor pitch decks, and marketing strategy documents. Particularly valuable when presenting quarterly or annual performance comparisons across multiple KPIs simultaneously.
-
Slide Structure
Two-slide template featuring horizontal 100% stacked bar charts representing data from 2028 to 2031 across four value series (Value 1, Value 2, Value 3, and additional categories). Color-coded with blue primary series and gray/black secondary series for clear visual distinction. Includes data labels and legend for immediate presentation readiness.
Related Products
-

Stacked Bar Graph for Growing Market Trends – Business Strategy
#Business Strategy #Market and Competitor Analysis #Graph
-

Yellow Green Detailed Analysis Chart - Visualizing Market Trends
#Business Strategy #Market and Competitor Analysis #Diagram
-

Comparison Graph of Business Trends by Year – Performance and Market Trends
#Business Strategy #Market and Competitor Analysis #Graph
-

Graph of Change in Number of Occurrences – Market Trends and Performance
#Business Strategy #Market and Competitor Analysis #Graph
