Comparison Graph of Business Trends by Year – Performance and Market Trends
RJ0900025_26
- Last Update 08/23/2025
- File Size 0.5MB
- # of Slides 2
- File Format PPTX
- Slide Ratio 16:9
- Color
Keywords
- #Content-Based Slides
- #Design-Based Slides
- #Business Strategy
- #Market and Competitor Analysis
- #Graph
- #Achievements
- #Industry Trends
- #Horizontal Bar
- #Segmented Horizontal Bar
- #16:9
- #horizontal bar chart PowerPoint
- #year-over-year comparison slide
- #business performance template
- #multi-series bar graph
- #how to create comparison chart in PowerPoint
About the Product
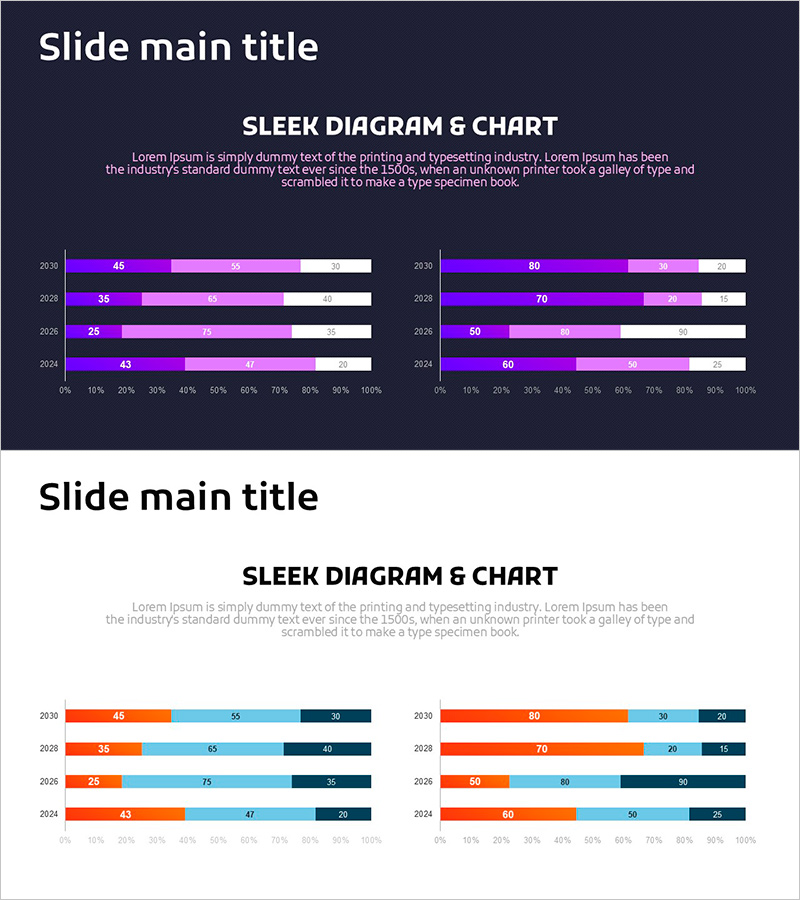
A horizontal bar chart PowerPoint slide comparing business performance across 4 years and 3 data series. Visualizes 2024 through 2030 data with three metrics (primary performance, secondary performance, market trends) displayed side-by-side for each year, enabling quick trend analysis. Features a dark background with purple, pink, and white bar colors, clear 0%-100% scale axis, and data labels on each bar. Ready for business reports, executive presentations, and performance analysis decks. All colors, values, and labels are fully editable.
Usage Points
-
Main Usage
Compares business performance and market trends across 4 years using 3 distinct data series simultaneously. Bar length and color differentiation convey relative magnitude and ranking intuitively, with 0-100% scale optimized for ratio-based data representation and trend visualization.
-
How to Use
Insert into business reports' performance analysis sections, executive briefing materials, quarterly or annual results presentations. Adjust bar lengths and colors to match your data, update year labels and legend, and deploy immediately. Compatible with standard PowerPoint editing tools.
-
Recommended For
Business analysts, marketing teams, executives, consultants, and project managers presenting periodic reports, performance reviews, and market comparisons. Ideal for multi-year trend analysis and simultaneous multi-metric visualization in corporate settings.
-
Slide Structure
2-slide deck. Slide 1: Dark background with 4-year (2024-2030) 3-series horizontal bar charts in two side-by-side layouts using purple, pink, and white. Slide 2: Light background with identical structure in orange, sky blue, and navy color scheme, providing alternative color option for different presentation contexts.
Related Products
-

Accumulated Horizontal Graphs Inside Nature – Market Trend Analysis
#Business Strategy #Market and Competitor Analysis #Graph
-

Stacked Bar Graph for Growing Market Trends – Business Strategy
#Business Strategy #Market and Competitor Analysis #Graph
-

Yellow Green Detailed Analysis Chart - Visualizing Market Trends
#Business Strategy #Market and Competitor Analysis #Diagram
-

Graph of Change in Number of Occurrences – Market Trends and Performance
#Business Strategy #Market and Competitor Analysis #Graph
