Business Forest Wide Template Line Chart – Highlighting Financial Performance
RJ0200026_19
- Last Update 04/04/2025
- File Size 0.1MB
- # of Slides 2
- File Format PPTX
- Slide Ratio 16:9
- Color
Keywords
About the Product
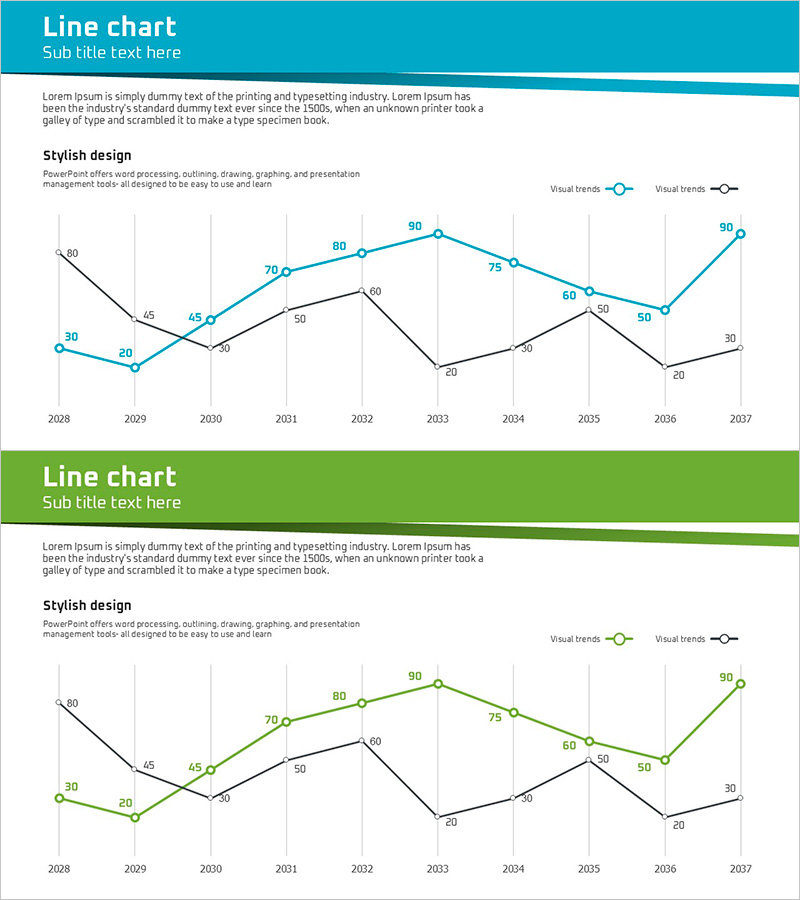
A dual-series line chart PowerPoint slide designed to compare data trends over time with blue and green line series. This presentation slide effectively visualizes financial performance, sales trends, and business metrics across a 10-year timeline from 2008 to 2037. Each data point is clearly labeled with numerical values, making it ideal for business reports and performance presentations. The two-color design allows viewers to instantly distinguish between different datasets while tracking changes and patterns across the entire period.
Usage Points
-
Main Usage
Compare two datasets over time by displaying financial performance, sales trends, or business metrics using dual-series line visualization. The blue and green line series enable clear differentiation between datasets while showing upward and downward trends simultaneously for comprehensive performance analysis.
-
How to Use
Use in business reports, financial analysis presentations, marketing performance reviews, and quarterly or annual results comparisons. Edit the numerical values at each data point with your own figures for immediate use. Customize colors and series count as needed for your specific presentation requirements.
-
Recommended For
Finance professionals, business planning teams, marketing departments, and executives presenting performance metrics and comparative analysis. Ideal for quarterly results, annual performance reviews, competitive benchmarking, and multi-year trend analysis across various business contexts.
-
Slide Structure
Two-slide set. First slide features blue header background with blue and black dual-series line chart. Second slide has green header background with green and black dual-series line chart. Both slides include 10 data points spanning 2008-2037, legend indicators, and grid lines for reference.
Related Products
-

Cost Increase Rate Analysis Chart
#Financial Plans and Performance #Diagram #Graph
-

Fashion Market Sales Status Graph – Data Visualization and Trend Analysis
#Market and Competitor Analysis #Financial Plans and Performance #Graph
-

Graph Analysis by Year Sales
#Market and Competitor Analysis #Financial Plans and Performance #Graph
-

Graph of Sharp Drop in Sales – Scenarios of Loss and Recovery
#Financial Plans and Performance #Graph #Sales and Revenue
