Business Forest Wide Template Bar Chart – Market Analysis and Competitive Strategy
RJ0200026_13
- Last Update 04/04/2025
- File Size 0.6MB
- # of Slides 2
- File Format PPTX
- Slide Ratio 16:9
- Color
Keywords
- #Content-Based Slides
- #Design-Based Slides
- #Market and Competitor Analysis
- #Marketing Plan and Strategy
- #Graph
- #Competitive Advantage
- #Distribution Strategy
- #Horizontal Bar
- #Grouped Horizontal Bar
- #16:9
- #horizontal bar chart PowerPoint
- #grouped bar chart template
- #year-over-year comparison slide
- #market analysis graph
- #competitive strategy chart
- #data visualization PowerPoint
About the Product
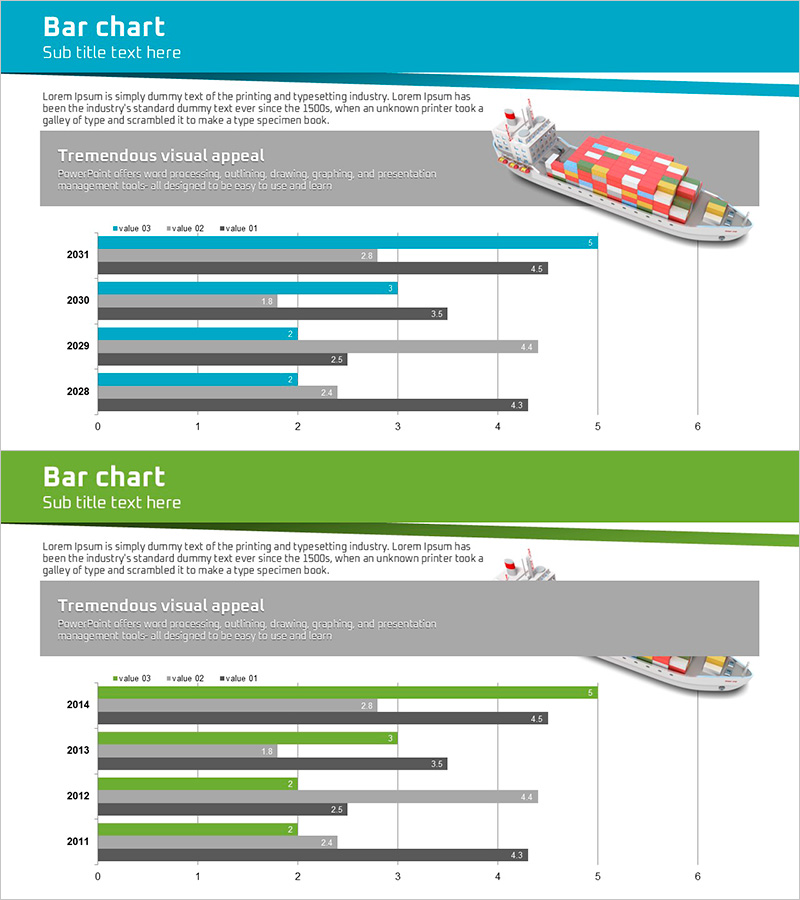
A horizontal bar chart PowerPoint slide optimized for market analysis and competitive strategy presentations. This grouped bar chart features three color series (teal, gray, and black) designed to compare data across four years (2028–2031) with three metrics (value 01, 02, 03) displayed side-by-side for each year. The layout enables clear trend analysis and performance benchmarking across multiple data points simultaneously. A container ship illustration in the background reinforces the context of global business and distribution strategy. The 2-slide set provides the same chart structure with color variations (teal and green themes) to add visual diversity to your presentation. Fully editable PPTX format allows you to input your own data and customize the slides instantly.
Usage Points
-
Main Usage
This chart is optimized for parallel comparison of numerical data across years and metrics. By displaying three data points for each of four years simultaneously, it clearly visualizes trends and performance differences. Suitable for any presentation requiring quantitative comparisons such as market size, sales revenue, market share, or growth rate analysis.
-
How to Use
Use this chart in the market analysis section of executive reports, business plans, or marketing strategy presentations to compare competitors, track market share trends, or present sales performance. The bar length and color coding communicate both data magnitude and category simultaneously, enhancing audience comprehension. Clear numerical labels ensure accurate data communication.
-
Recommended For
Recommended for executives, strategists, marketing managers, sales leaders, consultants, and analysts who base decisions on quantitative data. Particularly effective for market analysis, competitive strategy, business performance reporting, and investor pitch presentations where credible data visualization is essential.
-
Slide Structure
2-slide set with identical chart layouts in different color themes. Each slide includes a title area, descriptive text box, grouped horizontal bar chart (4 years × 3 metrics), and a container ship illustration. The first slide features a teal color scheme while the second uses a green theme, allowing flexible selection based on presentation flow.
Related Products
-

Blue Green Bundled Chart – Visualizing Market Trends
#Market and Competitor Analysis #Graph #Industry Trends
-

Summary Analysis Bar Chart Bundle – Optimal for Market Competitor Analysis
#Market and Competitor Analysis #Graph #Competitor Analysis
-

Vertical Bar Chart Slide for Data Comparison
#Market and Competitor Analysis #Graph #Competitor Analysis
-

Natural Environment Horizontal Bar Graph – Market Analysis
#Market and Competitor Analysis #Graph #Market Status
