Sales Status Average Slide
RJ0600100_13
- Last Update 07/18/2025
- File Size 0.4MB
- # of Slides 2
- File Format PPTX
- Slide Ratio 16:9
- Color
Keywords
- #Content-Based Slides
- #Design-Based Slides
- #Market and Competitor Analysis
- #Graph
- #Future Outlook
- #Competitive Advantage
- #Horizontal Bar
- #Grouped Horizontal Bar
- #16:9
- #horizontal bar chart PowerPoint
- #sales performance slide
- #data visualization template
- #5-item comparison chart
- #bar graph PowerPoint template
- #business report slide
About the Product
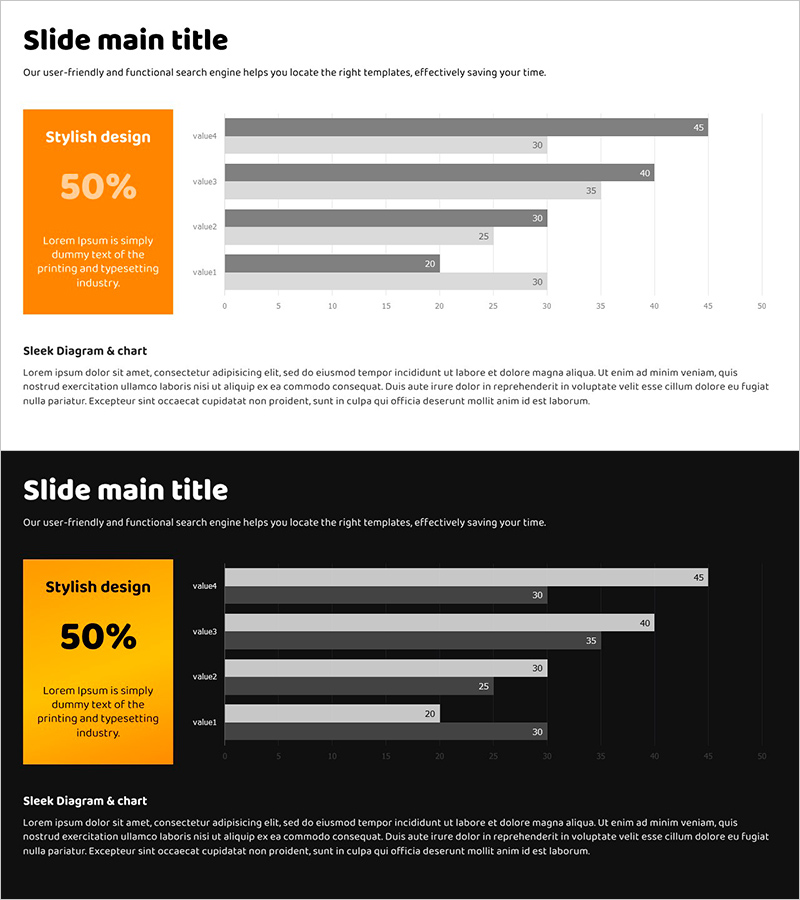
A horizontal bar chart PowerPoint slide set designed for sales performance and market analysis presentations. This 2-slide template features an orange accent box paired with gray bars, enabling clear comparison of five data points on a 0–50 scale. The layout includes dedicated areas for title, subtitle, and legend, making it ideal for executive reports, quarterly performance reviews, and competitive analysis. Fully editable PPTX format in 16:9 aspect ratio, ready for immediate customization and deployment.
Usage Points
-
Main Usage
Visualize and compare five numerical metrics—such as sales figures, market share, or performance indicators—in a horizontal bar format. Supports data-driven decision-making in executive briefings, quarterly earnings presentations, and competitive landscape reviews.
-
How to Use
Slide 1 emphasizes a key metric (50%) with an orange highlight box alongside the bar chart. Slide 2 presents the same layout on a dark background for contrast. Simply replace the sample values and labels with your actual data, then insert into your presentation deck.
-
Recommended For
Sales, marketing, and business planning professionals presenting quarterly results, market analysis findings, or competitive benchmarking. Also suitable for business plans, proposals, and investor pitch decks requiring performance metric visualization.
-
Slide Structure
Slide 1: Title area + orange accent box (50% metric display) + descriptive text + 5 horizontal bars (0–50 scale). Slide 2: Black background version with identical layout for contrast. Each bar is individually editable; legend and axis labels are included for full customization.
Related Products
-

Business Forest Wide Template Bar Chart – Market Analysis and Competitive Strategy
#Market and Competitor Analysis #Marketing Plan and Strategy #Graph
-

Horizontal Bar Chart for Construction Project Performance Analysis – Stability and Growth
#Market and Competitor Analysis #Diagram #Graph
-

Product Analysis Comparison Graph – Visualizing Market Status
#Market and Competitor Analysis #Graph #Market Status
-

Camping Market Future Outlook Graph
#Market and Competitor Analysis #Graph #Future Outlook
