Natural Environment Horizontal Bar Graph – Market Analysis
RJ0600020_11
- Last Update 06/26/2025
- File Size 0.6MB
- # of Slides 2
- File Format PPTX
- Slide Ratio 16:9
- Color
Keywords
About the Product
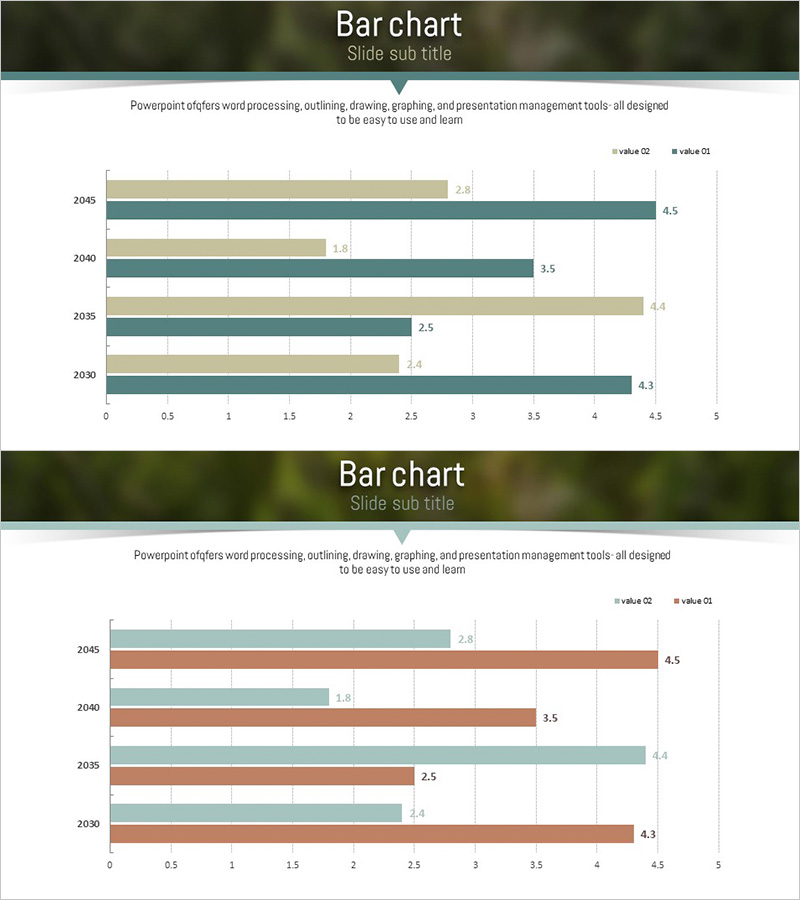
A horizontal bar chart PowerPoint slide featuring natural environment colors in brown and blue tones. This template displays 2 data series side-by-side to compare market conditions across years (2030–2045) with clarity and precision. Each bar includes value labels, and gridlines facilitate easy data reading. Ideal for business presentations, reports, and proposals where you need to visualize competitive analysis, market size trends, performance metrics, or year-over-year comparisons in a professional format.
Usage Points
-
Main Usage
Designed to compare numerical data across two categories or time periods using grouped horizontal bars. Effectively visualizes market size, revenue, customer satisfaction, competitor performance, or any metric requiring side-by-side comparison.
-
How to Use
Bar length represents data magnitude visually, while labeled values provide exact figures. Use during presentations to explain year-over-year trends, highlight gaps between series, assess performance targets, or benchmark against competitors.
-
Recommended For
Marketing plans, business reports, investor pitch decks, and executive summaries. Recommended for marketing, planning, sales, and management professionals who need to present market analysis and competitive positioning.
-
Slide Structure
2-slide set. Each slide contains a grouped horizontal bar chart with 2 data series (value Q2 and value Q1) representing 5 years (2030–2045). Brown and blue colors distinguish series; gridlines and value labels ensure accurate data interpretation.
Related Products
-

Visualizing Market Status with Horizontal Bar Chart – Emphasizing Competitive Edge
#Market and Competitor Analysis #Graph #Market Status
-

Product Analysis Comparison Graph – Visualizing Market Status
#Market and Competitor Analysis #Graph #Market Status
-

Colorful Bell Graph Slide – Market Status Analysis
#Market and Competitor Analysis #Graph #Market Status
-

Test Tube Bar Graph for Market Analysis – Highlighting Competitive Advantage
#Market and Competitor Analysis #Graph #Market Status
