Rainbow Paper Doughnut Chart Presentation Template
RJ0200024_5
- Last Update 04/04/2025
- File Size 4.6MB
- # of Slides 2
- File Format PPTX
- Slide Ratio 16:9
- Color
Keywords
- #Content-Based Slides
- #Design-Based Slides
- #Product/Service Introduction
- #Market and Competitor Analysis
- #Graph
- #Development Status
- #Market Share
- #Circles
- #Doughnut Chart
- #16:9
- #doughnut chart PowerPoint
- #pie chart slide template
- #data visualization PPT
- #percentage distribution slide
- #business analytics presentation
- #donut graph template
About the Product
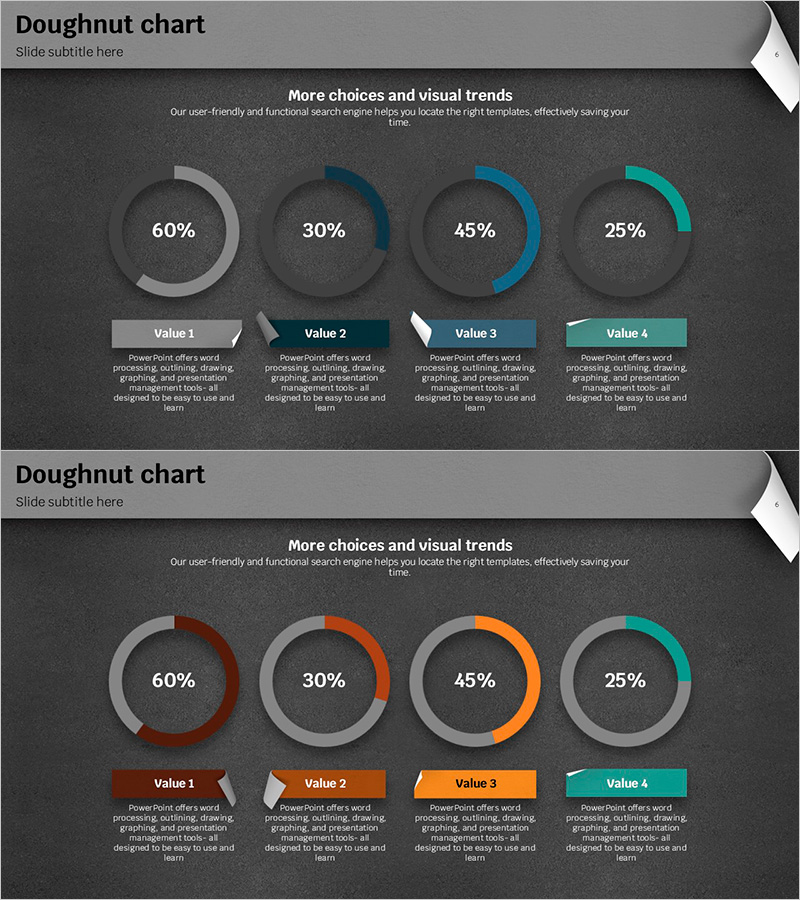
A professional doughnut chart PowerPoint slide designed to display proportional data across four categories with visual impact. The dark background features gradient-rendered rainbow-colored arcs (gray, navy, light blue, and teal) representing data values (60%, 30%, 45%, 25%) with precision. Two layout variations provide flexibility for market analysis, customer satisfaction metrics, sales distribution, and budget allocation presentations. Each chart includes labeled segments and descriptive text areas below, enabling seamless integration into business reports and pitch decks. The high-contrast design ensures clarity in projection environments.
Usage Points
-
Main Usage
Visualize proportional data across four segments with immediate clarity and professional appearance. Perfect for presenting market share, customer satisfaction distribution, sales channel breakdown, and budget allocation. The high-contrast dark background ensures excellent readability in projection and digital presentation environments.
-
How to Use
Replace the percentage values and labels with your actual data. Select the layout variant that best fits your presentation context, then edit the text fields below each chart with item names and descriptions. Adjust the colored arcs manually or reference existing values for consistency.
-
Recommended For
Finance, marketing, and sales teams presenting quarterly or annual performance reports, market research findings, customer satisfaction surveys, budget planning, and product sales analysis. Suitable for executive briefings, investor presentations, and internal stakeholder meetings.
-
Slide Structure
Slide 1: Four doughnut charts arranged horizontally with gradient arcs (gray, navy, light blue, teal) displaying percentages, each with labeled segments (Value 1–4) and descriptive text boxes below. Slide 2: Identical structure with alternative color arc positioning and saturation. Both slides in 16:9 aspect ratio, PPTX format.
Related Products
-

Development Status Analysis Donut Chart – Market Share Visualization
#Product/Service Introduction #Market and Competitor Analysis #Graph
-

Sales Status Analysis Graph – Simple and Stylish Design
#Product/Service Introduction #Market and Competitor Analysis #Graph
-

Analysis of Transportation Usage Status – Pie Chart
#Product/Service Introduction #Market and Competitor Analysis #Graph
-

Business Idea Development Status Graph – Ideas and Growth
#Product/Service Introduction #Market and Competitor Analysis #Graph
