Development Status Analysis Donut Chart – Market Share Visualization
RJ0300092_5
- Last Update 05/15/2025
- File Size 1.1MB
- # of Slides 2
- File Format PPTX
- Slide Ratio 16:9
- Color
Keywords
- #Content-Based Slides
- #Design-Based Slides
- #Product/Service Introduction
- #Market and Competitor Analysis
- #Graph
- #Development Status
- #Market Share
- #Circles
- #Doughnut Chart
- #16:9
- #donut chart PowerPoint
- #pie chart slide template
- #market share visualization
- #ratio analysis slide
- #donut graph presentation
- #business analytics PPT
About the Product
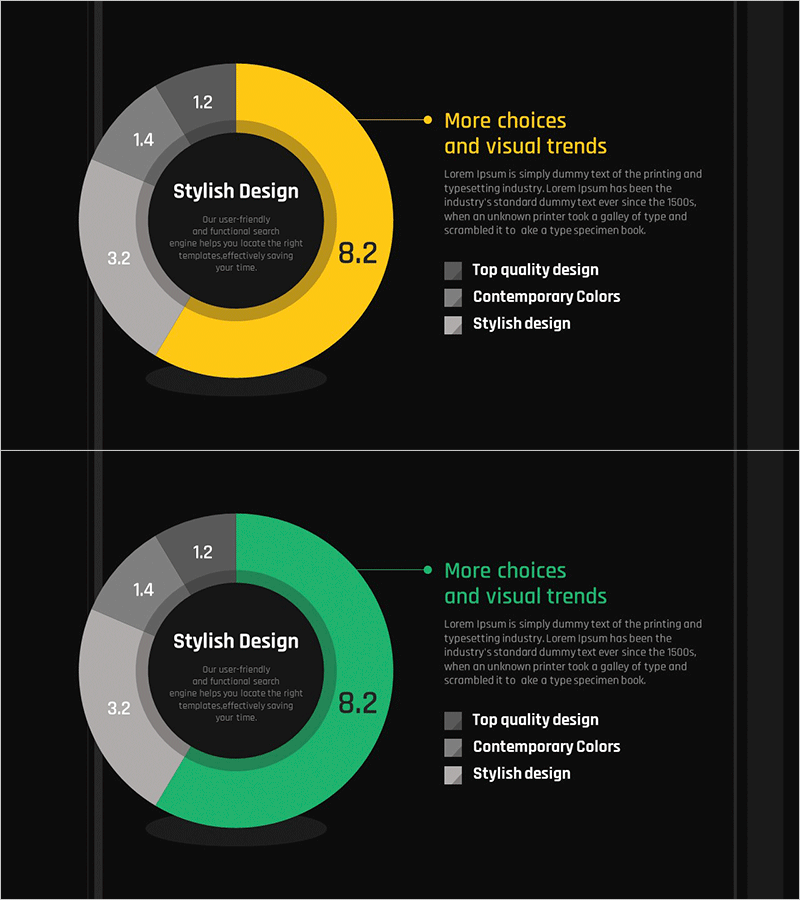
A professional donut chart PowerPoint slide featuring a black background with yellow and green accent colors. The design includes a central circular area for title and descriptive text, with the outer donut ring divided into 4 segments to visualize data ratios and percentages. This 2-slide set provides both yellow and green color variations, optimized for 16:9 widescreen format. Ideal for business presentations including market share analysis, development status reports, sales distribution, and financial performance reviews.
Usage Points
-
Main Usage
Visualize proportional data and composition ratios through a donut chart design. The central circular area emphasizes key messages with title and description, while the 4 outer segments clearly display item-specific percentages and numerical values for comprehensive data communication.
-
How to Use
Use in business reports, marketing analysis presentations, investor pitch decks, and executive briefings to represent market share, sales percentages, development progress, customer composition, and other ratio-based metrics. Select the yellow version for positive and dynamic messaging, or the green version to convey growth and stability themes.
-
Recommended For
Financial analysts, marketing managers, business strategists, and executives preparing data-driven presentations. Particularly effective for quarterly performance reports, market analysis presentations, management meetings requiring comparative ratio analysis, and strategic planning sessions.
-
Slide Structure
2-slide set with each slide featuring a central black circular area (for title and descriptive text input) and an outer donut ring divided into 4 segments (for ratio visualization). First slide emphasizes yellow accent color, second slide features green accent color. Each segment includes numerical labels and a legend for clear data interpretation.
Related Products
-

Map Donut Graph for Visualizing Market Share – Symbol of Practicality and Change
#Product/Service Introduction #Market and Competitor Analysis #Graph
-

Analysis graph of market share progress
#Product/Service Introduction #Market and Competitor Analysis #Graph
-

Analysis of Work Progress – Utilizing Pie Chart
#Product/Service Introduction #Market and Competitor Analysis #Graph
-

Financial Business Analysis Pie Chart – Market Share Insights
#Product/Service Introduction #Market and Competitor Analysis #Graph
