Line Graph and Future Outlook Text – Market Analysis and Competitive Advantage
RJ0500018_12
- Last Update 06/11/2025
- File Size 0.5MB
- # of Slides 2
- File Format PPTX
- Slide Ratio 16:9
- Color
Keywords
About the Product
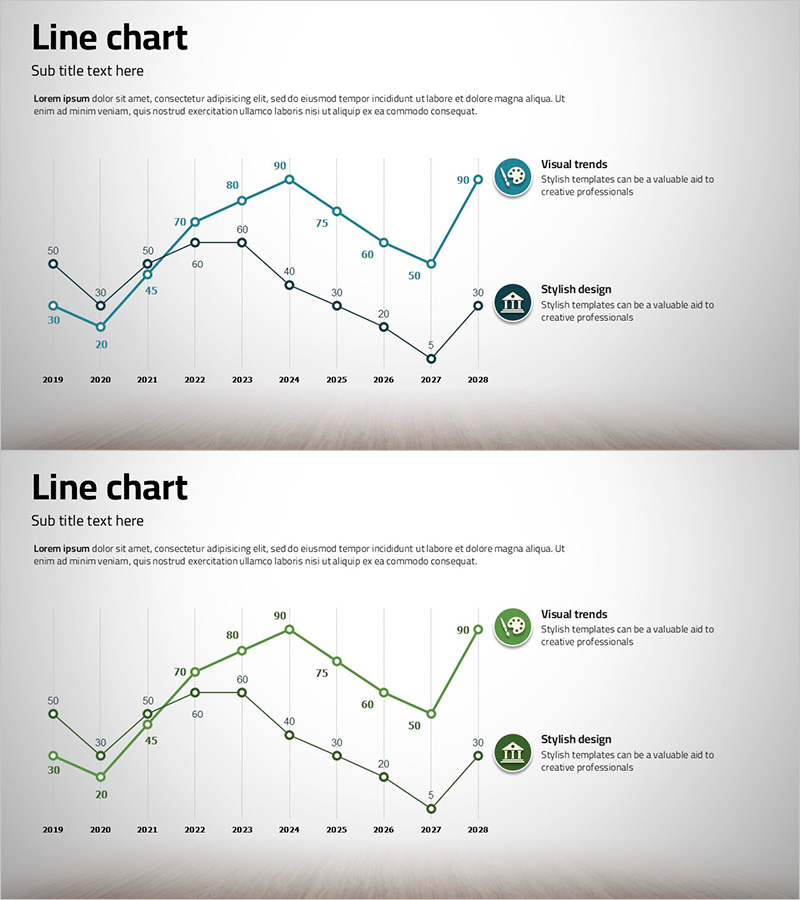
A multi-series line chart PowerPoint slide designed for market analysis and competitive advantage presentations. Visualizes data trends from 2019 to 2028 across three data series using blue and green color schemes, with clear line differentiation for easy comparison. Each data point is labeled with numerical values for precise information delivery, and icon-based annotation areas on the right side highlight key insights. Available in 16:9 PPTX format for immediate editing and integration into business reports, marketing plans, investment pitches, and strategic presentations.
Usage Points
-
Main Usage
Effectively visualizes long-term trends and compares multiple data series simultaneously. Ideal for presenting market growth rates, competitor benchmarking, revenue progression, and other metrics that change over time. Enables clear communication of complex multi-variable data in executive presentations.
-
How to Use
Modify line colors and labels to match your dataset. Update data point values and replace icon-area text with your key insights. Insert into business report market analysis sections, marketing plan competitive analysis pages, or investment materials performance indicator slides. Fully editable in PowerPoint for custom branding and data integration.
-
Recommended For
Executives, marketing managers, business strategists, financial analysts, and consultants presenting market trends and competitive positioning. Suitable for quarterly and annual performance reports, competitor benchmarking analysis, market share evolution, customer satisfaction trends, and multi-year strategic forecasts.
-
Slide Structure
Slide 1: Title and subtitle area + 3-series line chart spanning 2019–2028 (10-year data) + right-side icon-based annotation boxes (2 callouts). Slide 2: Identical layout in green color variant. Each line features circular data point markers with numerical labels; grid background ensures readability and professional appearance.
Related Products
-

Sales Performance Comparison Slide – Market Analysis and Competitive Edge
#Market and Competitor Analysis #Graph #Future Outlook
-

Camping Market Future Outlook Graph
#Market and Competitor Analysis #Graph #Future Outlook
-

Create Line Charts with Rainbow Paper Template
#Market and Competitor Analysis #Graph #Future Outlook
-

Forward-looking Line Chart – Market Growth Prediction
#Market and Competitor Analysis #Graph #Future Outlook
