Real Estate Construction Status Graph – Market Analysis and Future Forecast
RJ0900014_14
- Last Update 08/19/2025
- File Size 3MB
- # of Slides 2
- File Format PPTX
- Slide Ratio 16:9
- Color
Keywords
About the Product
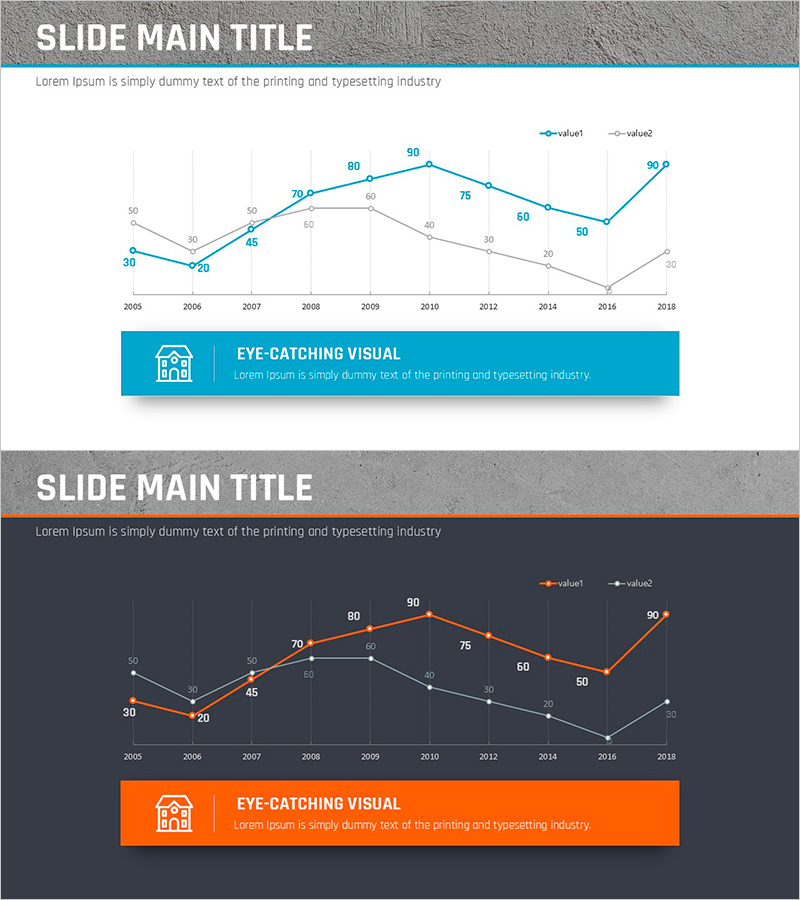
A dual-series line chart PowerPoint slide designed to visualize real estate and construction market trends over time. This presentation template tracks data changes from 2005 to 2018, comparing two key indicators using contrasting blue and gray lines. The grid background and clearly marked data points enable precise value reading, making it ideal for market analysis and future outlook presentations. Provided in 16:9 widescreen PPTX format with fully editable colors and numerical values for seamless integration into your business deck.
Usage Points
-
Main Usage
Compare two key real estate market indicators simultaneously to present market conditions and future forecasts with compelling data visualization. Serves as a critical tool for executive reports, investor presentations, and market analysis briefings that require data-driven decision support.
-
How to Use
Input your actual real estate market data into the slide to represent indicator changes such as transaction volume or price indices. Assign the blue line to your primary metric and the gray line to your comparison metric, then customize the legend and axis labels to match your presentation context. The grid background aids value interpretation, and data point markers highlight key inflection points.
-
Recommended For
Ideal for real estate developers and construction companies' executive reports, financial institutions' market analysis presentations, government agencies' policy briefings, and consulting firms' industry analysis materials. Suitable for any business presentation requiring long-term trend data visualization with professional credibility.
-
Slide Structure
Composed of two line series with X-axis spanning 2005–2018 (14 data points) and Y-axis scaled 0–100. The blue series shows upward trend while the gray series depicts downward movement, with intersection points and extrema clearly marked. Includes legend, axis labels, and gridlines for enhanced data interpretation.
Related Products
-

Trend of Comparison Items in Line Chart – Emphasizing Market Outlook
#Market and Competitor Analysis #Graph #Future Outlook
-

Sales Performance Comparison Slide – Market Analysis and Competitive Edge
#Market and Competitor Analysis #Graph #Future Outlook
-

Comparison Emphasis Line Graph & Explanatory Text – Market Analysis and Competitive Advantage
#Market and Competitor Analysis #Graph #Future Outlook
-

Line Graph and Future Outlook Text – Market Analysis and Competitive Advantage
#Market and Competitor Analysis #Graph #Future Outlook
