Alphabet Study Bar Chart – Vibrant Design
RB0300034_5
- Last Update 03/10/2025
- File Size 2.2MB
- # of Slides 2
- File Format PPTX
- Slide Ratio 4:3
- Color
Keywords
- #Content-Based Slides
- #Design-Based Slides
- #Business Strategy
- #Market and Competitor Analysis
- #Financial Plans and Performance
- #Graph
- #Achievements
- #Market Status
- #Projected Return on Investment (ROI)
- #Column
- #Column Chart
- #4:3
- #vertical bar chart PowerPoint
- #bar graph slide template
- #4-item comparison chart
- #data visualization PowerPoint
- #how to create bar chart in PowerPoint
About the Product
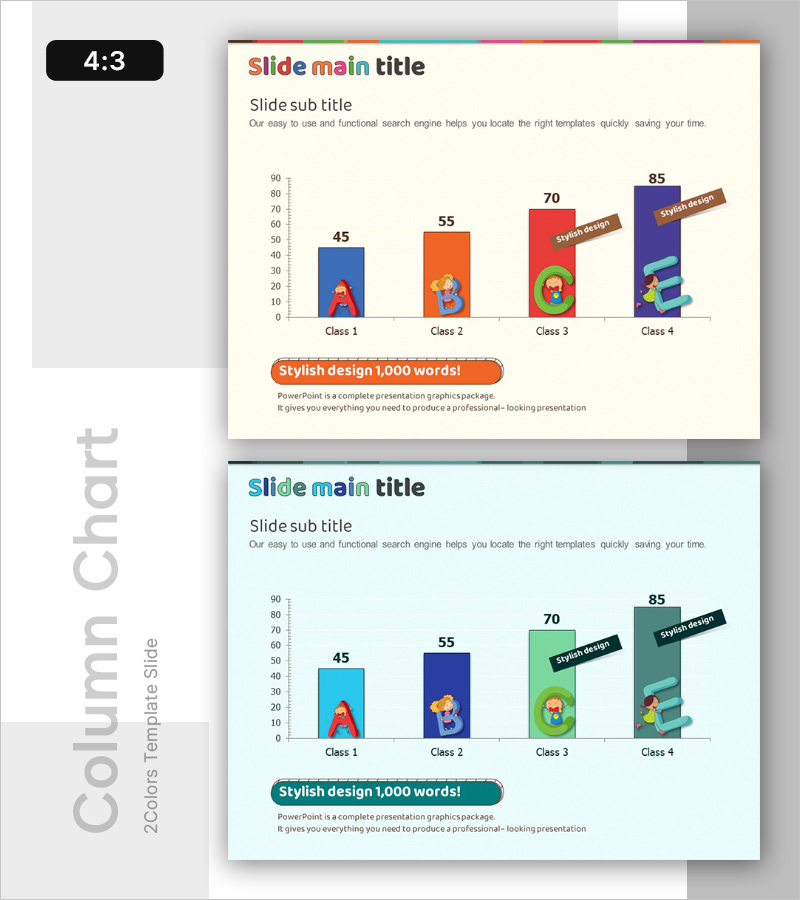
A vertical bar chart PowerPoint slide for comparing numerical data across four items. Each bar is displayed in a distinct color (blue, orange, red, purple) with illustrations and value labels positioned above. This presentation template is ready to use for educational materials, competitive analysis, market research, and any data comparison presentations. Editable 4:3 aspect ratio with 2 slides included.
Usage Points
-
Main Usage
Visualize and compare numerical data across four items using a vertical bar chart format. The bar heights intuitively show numerical differences, while distinct colors enhance item differentiation and visual clarity.
-
How to Use
Use in educational presentations to display learning progress, or in business analysis to compare four competitors, products, or regional markets. Simply edit the bar heights and value labels to input your actual data.
-
Recommended For
Ideal for educational institutions presenting learning progress reports, marketing teams conducting market analysis, sales teams comparing competitors, and planning teams presenting performance metrics. Suitable for any presentation requiring 4-item comparison.
-
Slide Structure
Y-axis scale from 0 to 90, X-axis labels for Class 1–4, four vertical bars with heights of 45, 55, 70, and 85, illustration icons and value labels above each bar, and a highlighted banner text area at the bottom.
Related Products
-

Rainbow Paper Presentation Template Column Chart1 – Visualizing Market Trends
#Business Strategy #Market and Competitor Analysis #Graph
-

Market Analysis Vertical Bar Graph
#Business Strategy #Market and Competitor Analysis #Graph
-

Bar Chart for Portion of Meals – Visualizing Market Status
#Market and Competitor Analysis #Graph #Market Status
-

Infographic Design Wide Template Chart2 for Market Analysis
#Market and Competitor Analysis #Graph #Market Status
