Market Analysis Vertical Bar Graph
RJ0600005_6
- Last Update 06/22/2025
- File Size 2.6MB
- # of Slides 2
- File Format PPTX
- Slide Ratio 16:9
- Color
Keywords
- #Content-Based Slides
- #Design-Based Slides
- #Business Strategy
- #Market and Competitor Analysis
- #Graph
- #Achievements
- #Market Status
- #Column
- #Column Chart
- #16:9
- #vertical bar chart PowerPoint
- #market analysis slide template
- #5-item comparison chart
- #how to create bar graph in PowerPoint
- #business data visualization slide
About the Product
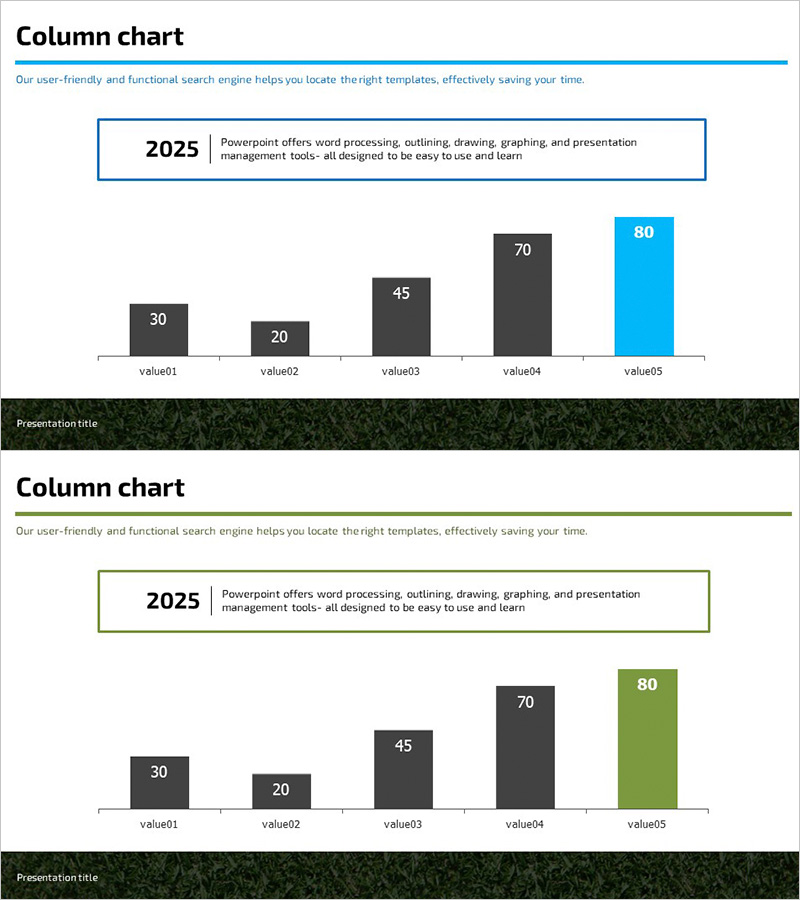
A vertical bar chart PowerPoint slide designed for market analysis and business strategy presentations. This slide effectively compares five data points with a structured layout featuring a 2025 year indicator and descriptive text area at the top. The chart combines dark gray baseline bars with accent colors (cyan blue and olive green) to highlight key metrics and draw attention to critical data. Ideal for business proposals, quarterly reports, and strategic presentations, with fully editable values and labels for seamless customization.
Usage Points
-
Main Usage
Visualizes comparative analysis of five metrics such as market size, competitor performance, sales volume, or customer satisfaction ratings. The top text box establishes analytical context and timeframe, while the accent-colored bar emphasizes the most critical data point, enabling clear communication of market insights.
-
How to Use
Insert into the market analysis or competitive landscape section of business proposals, marketing reports, or strategy presentations. Replace value labels (value01–value05) with actual data and update the title box with your analysis topic and period. Reposition the accent-colored bar to highlight your key metric.
-
Recommended For
Marketing managers, business analysts, and executives presenting market conditions, competitive benchmarking, or sales performance. Suitable for quarterly performance reviews, customer segment analysis, product line revenue comparisons, and data-driven decision-making presentations.
-
Slide Structure
Slide 1: Title area with 2025 year indicator + descriptive text box + 5-item vertical bar chart (4 dark gray bars + 1 accent color bar). Slide 2: Alternative color variant with olive green accent. 16:9 widescreen format, PPTX file.
Related Products
-

Alphabet Study Bar Chart – Vibrant Design
#Business Strategy #Market and Competitor Analysis #Financial Plans and Performance
-

Rainbow Paper Presentation Template Column Chart1 – Visualizing Market Trends
#Business Strategy #Market and Competitor Analysis #Graph
-

Farm Bar Graph for Market Analysis – Formulating Effective Business Strategies
#Business Strategy #Market and Competitor Analysis #Graph
-

Sports Vertical Bar Chart – The Perfect Choice for Performance Analysis
#Business Strategy #Market and Competitor Analysis #Graph
