Simple Design Trend Wide PPT – Essential Tool for Business Management
RJ0200059_26
- Last Update 04/15/2025
- File Size 0.2MB
- # of Slides 2
- File Format PPTX
- Slide Ratio 16:9
- Color
Keywords
- #Content-Based Slides
- #Design-Based Slides
- #Business Management
- #Diagram
- #Project Organization and Roles and Responsibilities
- #Project Staffing
- #Table
- #Standard Table
- #16:9
- #table slide PowerPoint
- #data comparison template
- #business metrics presentation
- #3-column table design
- #spreadsheet slide PowerPoint
About the Product
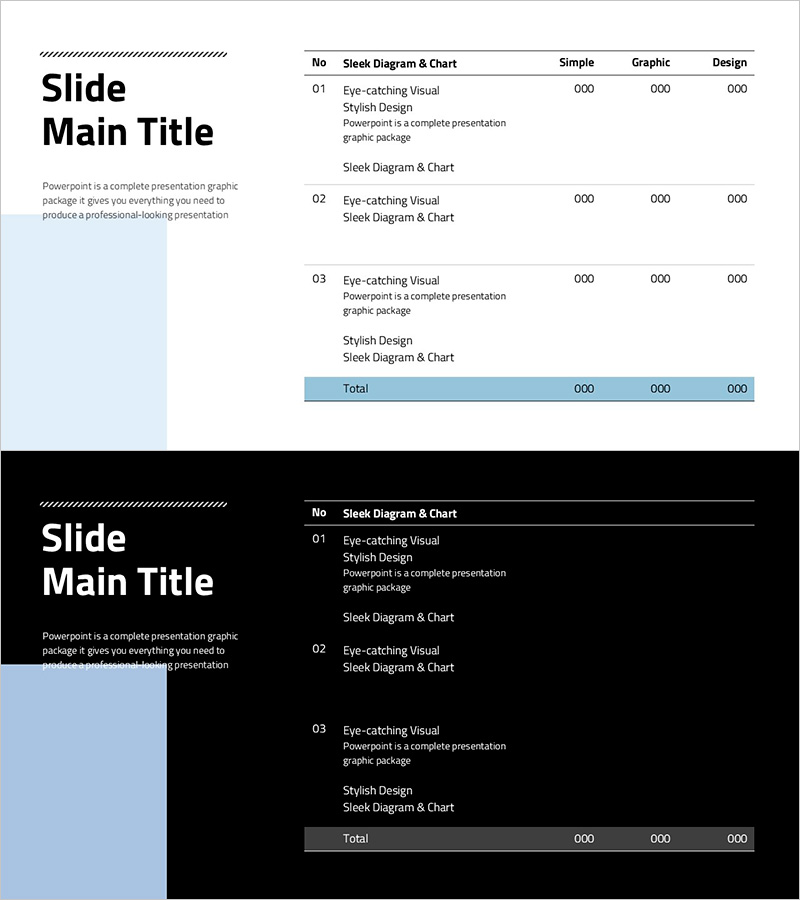
A professional 3-column table slide designed for business data comparison and analysis. Features a light blue header row with white background cells for clear information hierarchy. This 2-slide PowerPoint template uses a minimalist layout to maximize readability and data clarity. Ideal for presenting performance metrics, departmental comparisons, project status updates, and financial reports. Fully editable cells allow you to input custom data, metrics, and analysis across multiple business scenarios.
Usage Points
-
Main Usage
Organize and compare business metrics, performance data, or project information across three categories side-by-side. The structured table format enables clear visual comparison of numbers, percentages, or qualitative data, enhancing audience comprehension during reports and proposals.
-
How to Use
Enter category names in the header row (e.g., department, product, quarter) and corresponding data in the cells below. Customize cell colors, font sizes, and row heights as needed. Duplicate rows to expand the table or modify column widths to fit your content.
-
Recommended For
Executives, managers, and analysts presenting quarterly reports, departmental performance reviews, product comparisons, or budget allocations. Suitable for finance, marketing, operations, and strategy presentations requiring structured data visualization.
-
Slide Structure
Light blue header row (3 columns) with white data rows (3 columns). Two-slide set with independent layouts that can be used separately or sequentially. 16:9 widescreen format optimized for modern presentation displays and digital sharing.
Related Products
-

Process Management Checklist Table – Efficient Task Allocation
#Business Management #Diagram #Project Organization and Roles and Responsibilities
-

Contact Customer Checklist Slide – Customer Analysis and Market Understanding
#Product/Service Introduction #Business Management #Market and Competitor Analysis
-

Brown Orange Primary Table Chart – Business Management and Organizational Planning
#Business Management #Operational Plan #Diagram
-

Total Table Chart – Operations Planning and Business Management
#Business Management #Operational Plan #Diagram
