Safety Template Donut Chart – Visualizing Performance and Management
RJ0900011_21
- Last Update 08/19/2025
- File Size 0.2MB
- # of Slides 2
- File Format PPTX
- Slide Ratio 16:9
- Color
Keywords
- #Content-Based Slides
- #Design-Based Slides
- #Company Introduction
- #Market and Competitor Analysis
- #Graph
- #Key Achievements
- #Market Share
- #Circles
- #Doughnut Chart
- #16:9
- #donut chart PowerPoint
- #pie chart slide template
- #ratio data visualization
- #percentage breakdown slide
- #performance metrics template
About the Product
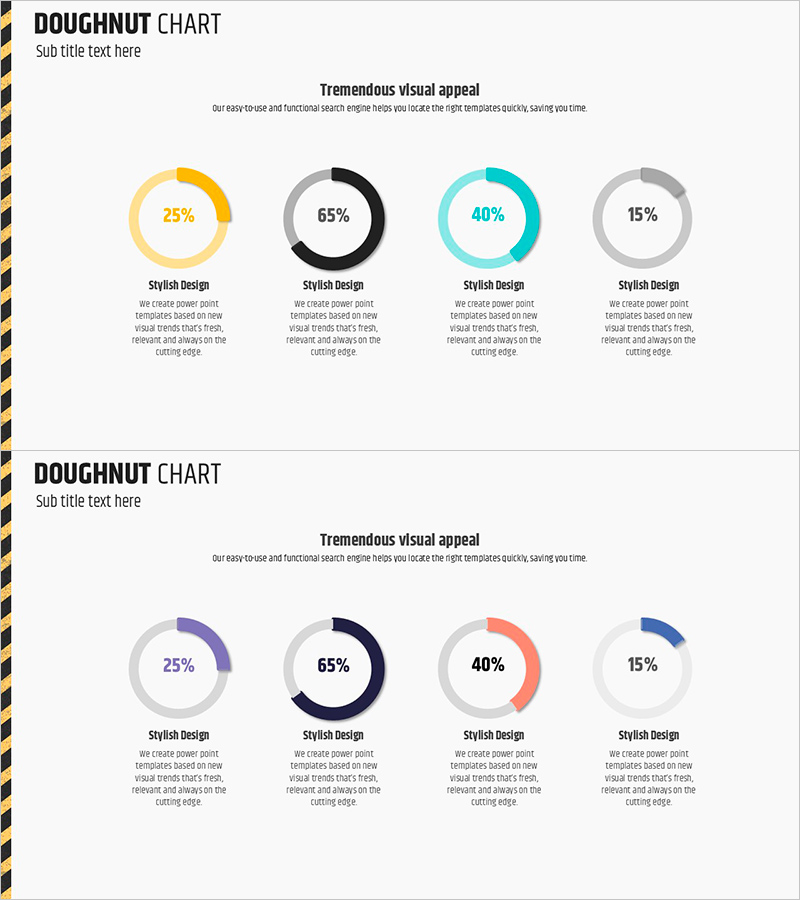
A 2-slide PowerPoint set featuring donut-shaped pie charts to represent proportional data across four categories. The first slide displays donut charts in yellow, black, cyan, and gray; the second offers an alternative color scheme with purple, black, orange, and blue. Each chart includes labeled sections with descriptive text areas below, making it ideal for presenting market share, performance metrics, budget allocation, and customer composition. Optimized for 16:9 widescreen format in fully editable PPTX.
Usage Points
-
Main Usage
Visualize proportional and compositional data using donut-shaped pie charts to clearly communicate market share, budget distribution, customer segments, and performance analysis. The circular format enables instant comprehension of part-to-whole relationships across four categories.
-
How to Use
Double-click the donut chart values and category labels to edit with your data. Choose between the two color-scheme versions based on your presentation theme and background. Add detailed descriptions in the text areas below each chart to provide data context and insights.
-
Recommended For
Financial reports showing budget composition, marketing plans with customer segmentation, business proposals with market share analysis, performance dashboards with achievement rates, organizational charts with staff distribution, and any presentation requiring proportional data representation.
-
Slide Structure
Slide 1: Four-segment donut chart in yellow, black, cyan, and gray with four labeled text areas / Slide 2: Alternative color scheme (purple, black, orange, blue) with identical layout. Each donut displays percentage in center with category labels and description zones positioned below.
Related Products
-

Market Share Donut Pie Chart – Visualization of Data Analysis
#Company Introduction #Market and Competitor Analysis #Diagram
-

Communication Marketing Donut Chart – Performance Visualization
#Company Introduction #Market and Competitor Analysis #Graph
-

Analyzing Market Share with Donut Chart – Clean and Stylish Design
#Company Introduction #Market and Competitor Analysis #Graph
-

Doughnut Chart for Market Share Analysis – Performance and Trends
#Company Introduction #Market and Competitor Analysis #Graph
