Rhombus Doughnut Chart PowerPoint Template – Performance and Market Share Analysis
RJ0200011_7
- Last Update 03/31/2025
- File Size 0.4MB
- # of Slides 2
- File Format PPTX
- Slide Ratio 16:9
- Color
Keywords
- #Content-Based Slides
- #Design-Based Slides
- #Company Introduction
- #Market and Competitor Analysis
- #Graph
- #Key Achievements
- #Market Share
- #Circles
- #Doughnut Chart
- #16:9
- #doughnut chart PowerPoint
- #donut graph presentation template
- #ratio data visualization slide
- #performance analysis chart
- #doughnut chart download
About the Product
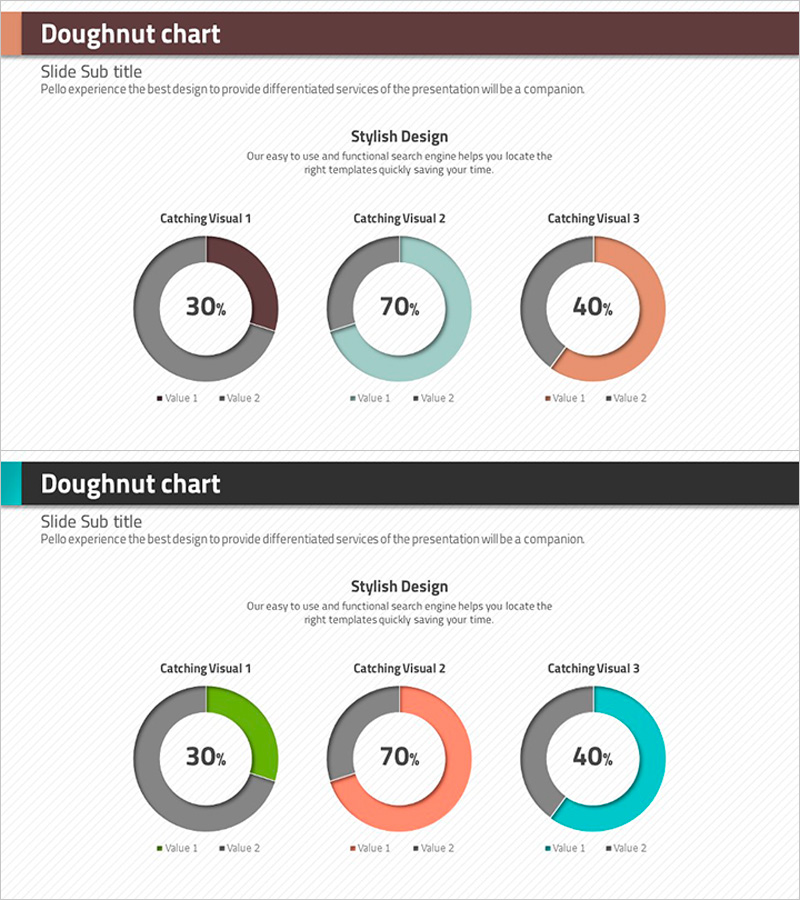
A professional doughnut chart PowerPoint slide optimized for business presentations and performance analysis. This template features three independent doughnut graphs arranged horizontally, each distinguished by different colors (brown, teal, and coral) for easy visual comparison. The central numbers (30%, 70%, 40%) emphasize key metrics, while legends clearly show the composition ratio of Value 1 and Value 2. Perfect for presenting company performance, market share, customer satisfaction, budget allocation, and other ratio-based data with immediate visual impact. Fully editable and optimized for 16:9 widescreen format.
Usage Points
-
Main Usage
Doughnut charts are a variation of pie charts that use the center space to highlight key metrics or titles. This slide template presents three independent doughnut graphs, making it ideal for comparing multiple items' proportions simultaneously. Effectively visualizes performance indicators, market share distribution, customer satisfaction scores, budget allocation, and product composition ratios.
-
How to Use
Simply replace the center numbers and legends with your own data. The three color-coded sections allow you to represent up to three items' proportions at once. During presentation, first explain each doughnut's meaning, then emphasize the numerical values to enhance audience comprehension. Use the subtitle area below each chart for additional context or explanations.
-
Recommended For
Ideal for executive reports, quarterly performance presentations, marketing status analysis, financial reports, and customer satisfaction survey results. Particularly valuable for CFOs, marketing managers, and business development teams presenting to executives or boards. Also suitable for academic presentations, consulting proposals, and investor pitch decks.
-
Slide Structure
Two-slide layout with three doughnut graphs arranged horizontally on each slide. Each doughnut comprises two data series (Value 1 and Value 2) with prominent central metrics. Title appears at the top, descriptive text in the middle section, and legends at the bottom, creating clear information hierarchy. Optimized for 16:9 widescreen displays and modern projectors.
Related Products
-

Rainbow Presentation Template Doughnut Chart – Start Your Unique Analysis
#Company Introduction #Market and Competitor Analysis #Graph
-

Visualizing Physical Championship Winning Status with Doughnut Chart
#Company Introduction #Market and Competitor Analysis #Graph
-

Visualization of Traditional Items Proportion – Market Share Analysis
#Company Introduction #Market and Competitor Analysis #Graph
-

Trend Color Donut Chart Slide Template – Market and Competitive Analysis
#Company Introduction #Market and Competitor Analysis #Graph
