Energy Resource Management Share Analysis – Market Share Visualization
RB0100011_4
- Last Update 03/02/2025
- File Size 0.7MB
- # of Slides 2
- File Format PPTX
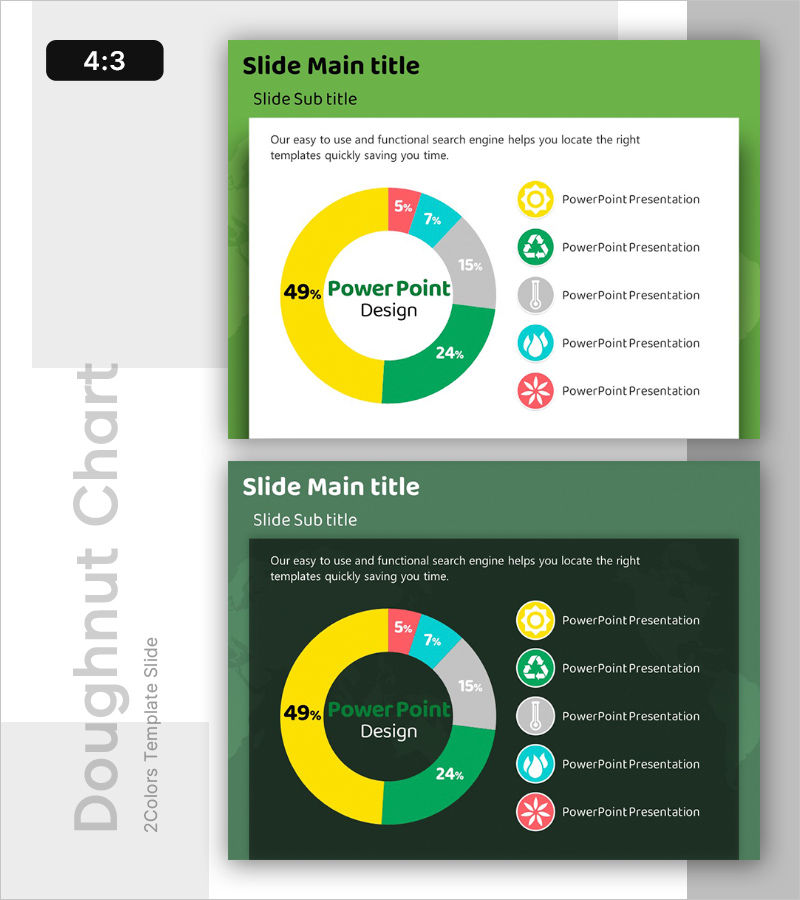
- Slide Ratio 4:3
- Color
Keywords
About the Product
A donut chart PowerPoint slide designed to visualize market share distribution in the energy and resource management sector. The slide features a five-segment donut chart with bright green background, displaying percentages (49%, 24%, 15%, 7%, 5%) in yellow, green, gray, red, and cyan colors. A legend with icons is positioned on the right side for clear data interpretation. This 4:3 ratio, 2-slide PPTX template is fully editable and ready for competitive analysis and market overview presentations.
Usage Points
-
Main Usage
Clearly visualize market share distribution, competitor ratios, and market composition in the energy and resource management industry using a donut chart. The center text area allows you to emphasize key messages and core insights.
-
How to Use
Use this slide in investor pitch decks, business reports, and marketing strategy presentations when explaining market analysis and competitive positioning. Simply replace the legend text and percentage values with your actual data for immediate presentation use.
-
Recommended For
Executives, marketing teams, and strategy departments in energy, resource, and environmental companies presenting market conditions and competitive analysis. Enhances credibility in investor presentations, employee training sessions, and client proposals through data-driven visualization.
-
Slide Structure
One donut chart with 5 segments, center text area for emphasis, right-aligned legend with 5 items (icon + text), title and subtitle area at top. Light green background with white content area provides excellent contrast and readability.
Related Products
-

Donut Chart PPT Template for Market Overview
#Market and Competitor Analysis #Graph #Market Status
-

Logistics Market Share Chart – Current Status and Competitive Analysis
#Market and Competitor Analysis #Graph #Market Status
-

Market Share Analysis Graph by Technology – Competition and Collaboration
#Market and Competitor Analysis #Diagram #Graph
-

Visualizing Fish Market Share with Doughnut Chart – Vitality of the Ocean
#Market and Competitor Analysis #Graph #Market Status
