Rainbow Presentation Template Area Chart – Customer Analysis and Market Trends
RJ0200022_18
- Last Update 04/03/2025
- File Size 3.9MB
- # of Slides 2
- File Format PPTX
- Slide Ratio 16:9
- Color
Keywords
- #Content-Based Slides
- #Design-Based Slides
- #Market and Competitor Analysis
- #Graph
- #Other
- #Customer Analysis
- #Target Market
- #Other
- #Area Chart
- #16:9
- #area chart PowerPoint
- #area graph template
- #data visualization slide
- #trend analysis chart
- #customer analysis presentation
- #market trends PowerPoint slide
About the Product
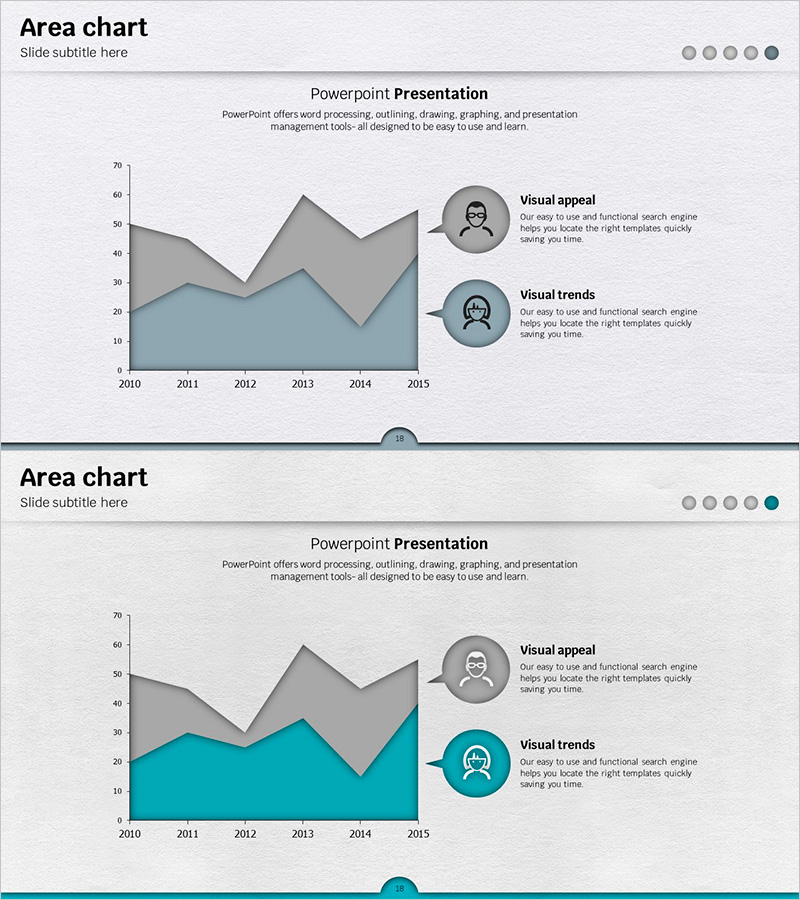
A 2-series area chart PowerPoint slide designed to visualize customer analysis and market trends from 2010 to 2015. The overlapping areas in gray and blue with transparent gradients clearly distinguish two data series and their progression over time. Each slide includes avatar icons and text callouts to highlight key insights. Available in 16:9 format with 2 slides, ready for immediate editing and perfect for marketing reports, business analysis presentations, and customer segmentation materials.
Usage Points
-
Main Usage
Optimized for displaying cumulative trends and individual series changes simultaneously. Visualizes customer growth, market share evolution, and sales comparisons by overlaying multiple data series to show both total volume and individual progression at a glance.
-
How to Use
Insert into marketing reports' customer analysis sections, business presentations' market trend pages, and quarterly performance reports' trend analysis portions. Edit the data values and legends to reflect your analysis, and add key insights next to the avatar icons.
-
Recommended For
Marketing managers, business analysts, financial reporting specialists, consultants, and executives preparing business presentations. Particularly effective for customer segmentation, market analysis, sales trends, and competitive analysis presentations.
-
Slide Structure
2-slide set visualizing 6-year data (2010–2015) with 2-series area chart on each slide. Gray upper area and blue lower area overlap with transparent gradients. Right side features 2 avatar icons with 'Visual appeal' and 'Visual trends' text callouts for insight emphasis.
Related Products
-

Premium Management Presentation Map Analysis3 - Customer Insights and Market Analysis
#Market and Competitor Analysis #Graph #Other
-

Customer Analysis by Country Slide – Market Trends and Insights
#Market and Competitor Analysis #Graph #Other
-

Data Visualization Slide Template Featuring World Map
#Market and Competitor Analysis #Graph #Other
-

Analysis of the Gender Ratio of Users in the US Market – A Blend of Teal and Gray
#Market and Competitor Analysis #Graph #Other
