User Usage Status by Target Country – Market Analysis and Insights
RJ0400054_8
- Last Update 06/01/2025
- File Size 0.6MB
- # of Slides 2
- File Format PPTX
- Slide Ratio 16:9
- Color
Keywords
- #Content-Based Slides
- #Design-Based Slides
- #Market and Competitor Analysis
- #Diagram
- #Other
- #Customer Analysis
- #Target Market
- #Cluster
- #Closed Cluster Diagram
- #Map
- #16:9
- #world map PowerPoint slide
- #regional user distribution presentation
- #global market analysis slide
- #continent data visualization
- #geographic infographic PPT
- #how to create world map in PowerPoint
About the Product
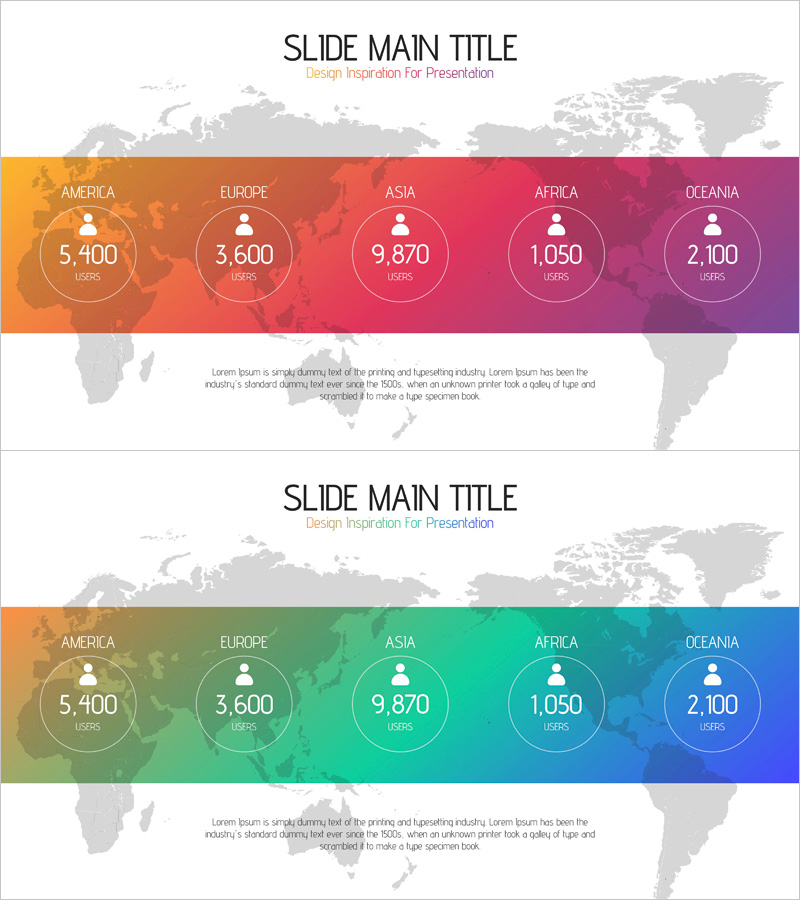
A PowerPoint slide that visualizes user statistics across five continents using a world map and circular data indicators. The slide features a gradient background transitioning from orange through red, pink, and purple, with each region marked by a circular icon displaying user counts: Americas 5,400, Europe 3,600, Asia 9,870, Africa 1,050, and Oceania 2,100. This design enables quick comparison of global user distribution and market penetration across regions. Ideal for market analysis presentations, customer demographic reports, and global business strategy discussions. All text, numbers, and colors are fully editable to match your specific data and branding.
Usage Points
-
Main Usage
Displays regional and country-level user distribution, revenue performance, and customer concentration across global markets in a single visual. The world map background combined with circular data indicators makes it easy to compare regional differences and communicate geographic market insights during international business strategy presentations.
-
How to Use
Use this slide in investor pitches, executive reports, marketing strategy presentations, and business expansion plans to illustrate global customer demographics. Simply replace the numbers and region labels with your own data, and adjust colors and icon sizes as needed to match your presentation theme.
-
Recommended For
Global company executives, marketing teams, sales departments, international business managers, market research analysts, investor relations (IR) professionals, and startup founders planning international expansion. Ideal for anyone presenting regional performance metrics and geographic customer distribution to stakeholders.
-
Slide Structure
Two-slide template featuring a world map with five continental regions marked by circular data indicators. The first slide uses an orange-to-purple gradient background, while the second provides an alternative green-to-blue gradient version. Both layouts maintain identical structure and positioning, allowing you to choose the color scheme that best fits your presentation context.
Related Products
-

Analysis of US Target Regions – Strategic Marketing and Opportunities
#Market and Competitor Analysis #Marketing Plan and Strategy #Diagram
-

Map-Based Data Presentation Slide – Global Market Analysis
#Market and Competitor Analysis #Other #Customer Analysis
-

Rocket Launch Progress by Country – Systematic Data Presentation
#Market and Competitor Analysis #Marketing Plan and Strategy #Diagram
-

Data Visualization Slide Template Featuring World Map
#Market and Competitor Analysis #Graph #Other
