Analysis of the Gender Ratio of Users in the US Market – A Blend of Teal and Gray
RJ0300026_20
- Last Update 04/24/2025
- File Size 1.6MB
- # of Slides 2
- File Format PPTX
- Slide Ratio 16:9
- Color
Keywords
About the Product
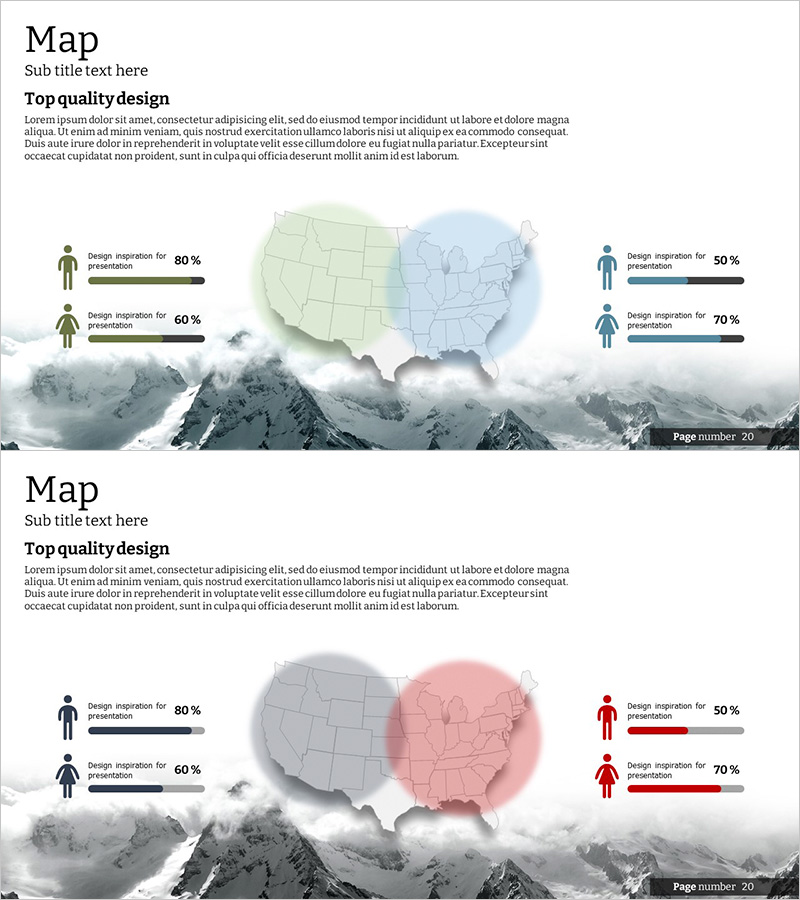
A PowerPoint slide visualizing the gender ratio of US market users by region. The US map is divided into teal and gray sections to compare male and female user percentages at a glance. The left side features icons and horizontal bar charts displaying design inspiration scores for four regions as percentages. A mountain background image and transparent map overlay add a premium aesthetic. This 2-slide set (16:9 ratio, PPTX format) is ready to use for market research, customer analysis, and target market presentations.
Usage Points
-
Main Usage
Communicate the geographic distribution of US market users by gender through map visualization and compare design inspiration scores across regions using percentages. Enables clear explanation of market segmentation to investors, partners, and executives.
-
How to Use
Insert into market research sections, customer analysis pages, or target market strategy presentations. Add actual percentage data to the left icon and chart areas, then adjust map colors to match your data.
-
Recommended For
Ideal for marketing plans, business proposals, investor pitch decks, and market analysis reports. Particularly suited for roles in marketing, planning, analytics, and sales discussing regional customer segmentation, gender-based targeting strategies, and market share analysis.
-
Slide Structure
Two-area layout: Left side includes title and description text, four gender-differentiated icons, and four horizontal bar charts with percentage labels. Right side features a two-region US map (teal and gray color distinction), transparent overlay, and mountain background. Contains three text input areas and eight data input areas (four icons plus four charts).
Related Products
-

Customer Analysis by Country Slide – Market Trends and Insights
#Market and Competitor Analysis #Graph #Other
-

Global User Status Analysis Graph – Data Visualization
#Market and Competitor Analysis #Graph #Other
-

Data Visualization Slide Template Featuring World Map
#Market and Competitor Analysis #Graph #Other
-

Premium Management Presentation Map Analysis3 - Customer Insights and Market Analysis
#Market and Competitor Analysis #Graph #Other
