Business Promotion Strategy Slide Template – Effective Information Delivery and Visual Composition
RJ0200022_16
- Last Update 04/03/2025
- File Size 3.8MB
- # of Slides 2
- File Format PPTX
- Slide Ratio 16:9
- Color
Keywords
- #Content-Based Slides
- #Design-Based Slides
- #Business Strategy
- #Graph
- #Other
- #Achievements
- #Column
- #Column Chart
- #Silhouette
- #Project Progress
- #16:9
- #column chart PowerPoint slide
- #year-over-year performance comparison
- #business promotion strategy chart
- #4-stage vertical bar graph
- #performance analysis presentation
About the Product
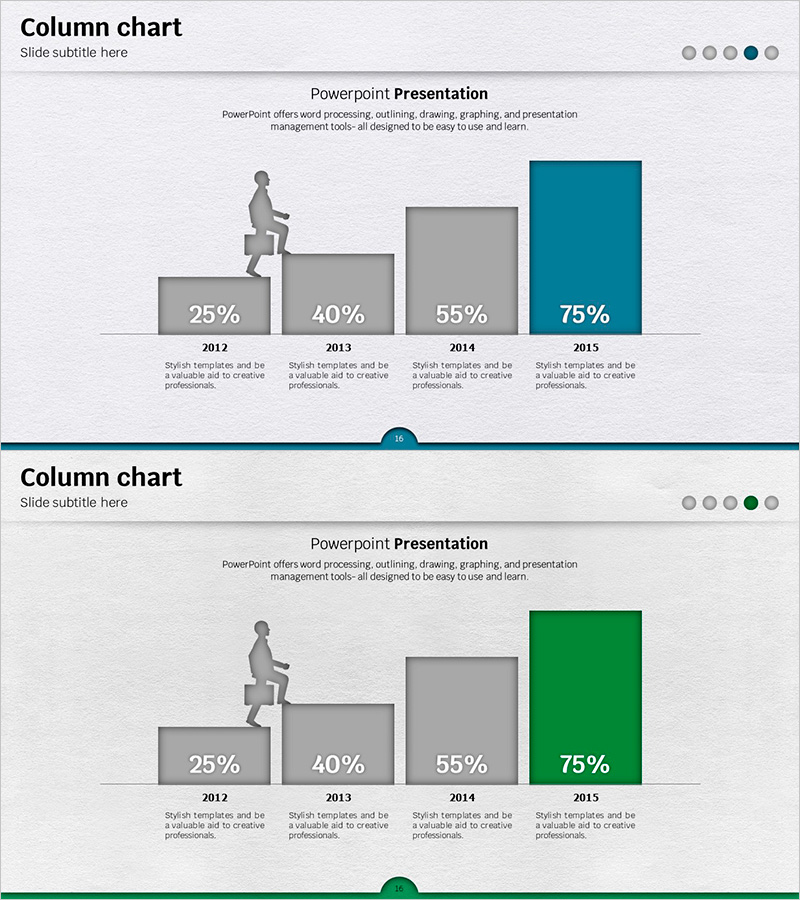
A vertical column chart PowerPoint slide designed to compare business promotion performance across four years (2012–2015). The slide uses a gray-to-accent color progression (teal and green) to highlight the highest achievement, making growth trends immediately visible. Each column includes a descriptive text area below for year labels and explanations, making it ready for business reports, performance presentations, and strategic reviews. The 16:9 widescreen format with 2-slide set ensures compatibility with modern presentation environments.
Usage Points
-
Main Usage
Enables quick comparison of year-over-year, quarterly, or category-based metrics while illustrating performance progression. The stepped bar heights naturally convey a growth narrative, while accent color application emphasizes peak performance or milestone achievement.
-
How to Use
Ideal for business reports, performance reviews, executive briefings, and quarterly updates. Simply enter year labels and descriptions in the text areas below each column, then adjust bar heights and colors to match your data values.
-
Recommended For
Business managers, marketing teams, executives, and project managers preparing performance analysis and trend reports. Particularly effective when highlighting time-series metrics such as quarterly revenue, customer growth, or project completion rates.
-
Slide Structure
Four vertical columns (25%, 40%, 55%, 75%) with descriptive text areas beneath each. The first three columns are gray; the final column is highlighted in teal or green. Title and subtitle areas are positioned at the top of the slide.
Related Products
-

Bar Chart Visualizing Steak Consumption
#Business Strategy #Market and Competitor Analysis #Graph
-

Vanity vs. Crisis Metric Slide – 2-Panel Dark Green & Red
#Business Strategy #Graph #Achievements
-

Square Frame Presentation Template – Vertical Bar Chart
#Business Strategy #Graph #Achievements
-

Exercise Ability Improvement Graph
#Business Strategy #Market and Competitor Analysis #Graph
