Square Frame Presentation Template – Vertical Bar Chart
RJ0200010_13
- Last Update 03/31/2025
- File Size 0.6MB
- # of Slides 2
- File Format PPTX
- Slide Ratio 16:9
- Color
Keywords
About the Product
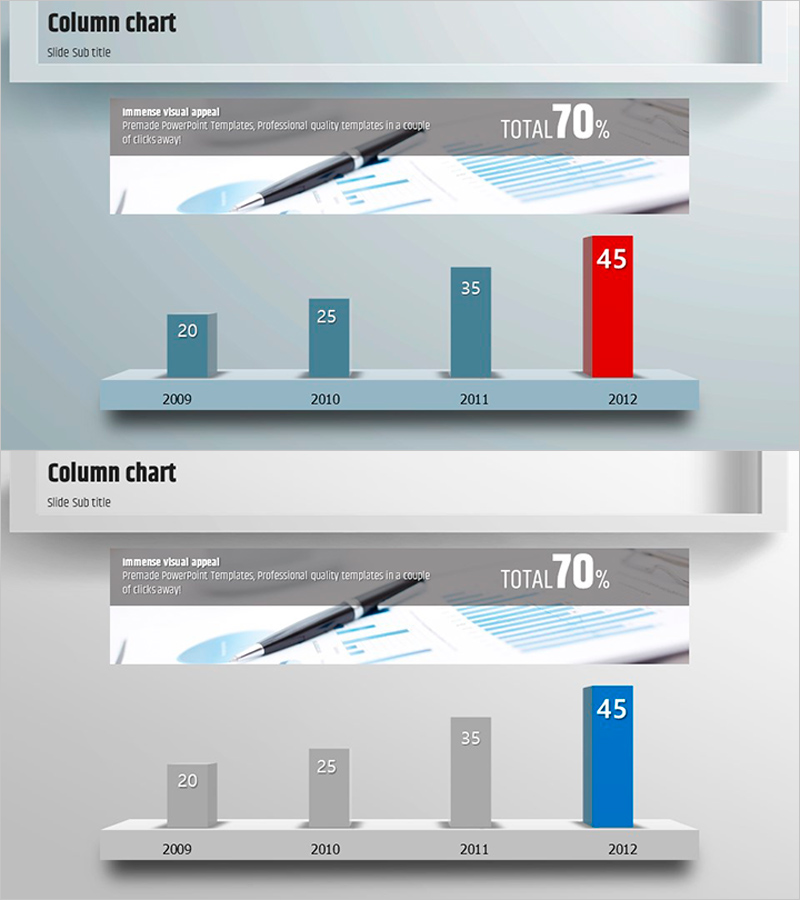
A professional vertical bar chart PowerPoint slide designed to visualize year-over-year performance trends from 2009 to 2012. The slide features four data points displayed as 3D columns with emphasis colors (red and blue) highlighting peak values against a light gray background. This presentation template effectively communicates quantitative data comparisons for business performance reports, sales metrics, and growth analysis. The slide is ready to use and fully editable for immediate integration into your presentation deck.
Usage Points
-
Main Usage
Designed to compare quantitative data trends across multiple years or periods at a glance. Ideal for business performance reporting, sales metrics presentation, growth rate analysis, and data-driven decision-making presentations.
-
How to Use
The bar heights and color coding visually represent numerical differences across years. Emphasis colors (red and blue) highlight peak values or target achievement, while the text area accommodates additional context and explanatory notes to strengthen the narrative.
-
Recommended For
Executive and management presentations for quarterly or annual performance reviews, marketing teams presenting campaign performance analysis, sales teams sharing revenue metrics, finance teams explaining profitability trends, and project teams conducting progress review meetings.
-
Slide Structure
Two-slide layout featuring identical chart structures in two color variations (blue-gray and red-gray combinations). Each slide displays four data points (2009–2012) as vertical columns with an information section at the top and legend area at the bottom for clarity.
Related Products
-

Business Promotion Strategy Slide Template – Effective Information Delivery and Visual Composition
#Business Strategy #Graph #Other
-

Vanity vs. Crisis Metric Slide – 2-Panel Dark Green & Red
#Business Strategy #Graph #Achievements
-

Analysis of Factors Contributing to Excellent Sales Performance – Visualizing Success
#Business Strategy #Financial Plans and Performance #Graph
-

Vertical Bar Chart for Achieving Goals – Growth and Fulfillment
#Business Strategy #Graph #Financial Outlook & Expected Impact
