Bar Chart Visualizing Steak Consumption
RJ0800042_5
- Last Update 08/12/2025
- File Size 0.5MB
- # of Slides 2
- File Format PPTX
- Slide Ratio 16:9
- Color
Keywords
- #Content-Based Slides
- #Design-Based Slides
- #Business Strategy
- #Market and Competitor Analysis
- #Graph
- #Other
- #Achievements
- #Competitive Advantage
- #Column
- #Column Chart
- #Silhouette
- #16:9
- #horizontal bar chart PowerPoint
- #bar graph slide template
- #data comparison chart
- #consumption analysis PPT
- #market analysis slide
About the Product
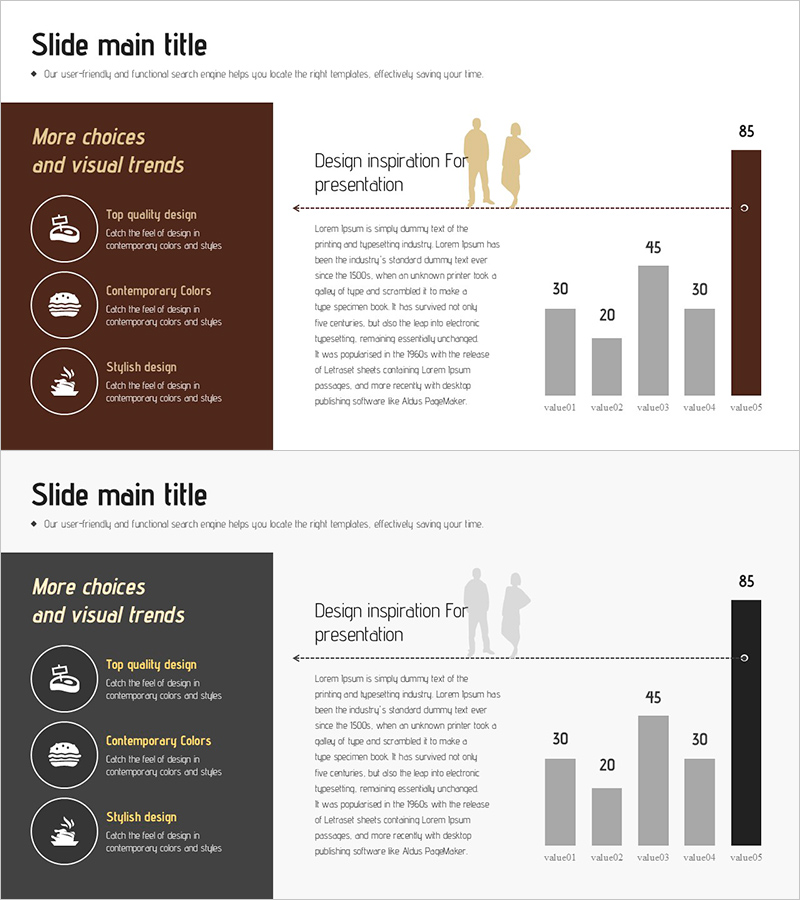
A horizontal bar chart PowerPoint slide comparing steak consumption across five categories with visual clarity and professional design. The slide features a two-tone color scheme combining brown and gray tones to emphasize data hierarchy, complemented by silhouette figures on the right side that add contextual visual interest. With a 2-slide structure, this presentation template is ready to use immediately in various business contexts. The bar lengths intuitively represent numerical differences, making it ideal for market analysis, competitive benchmarking, and business strategy presentations. Easily editable to accommodate your own data while maintaining visual consistency.
Usage Points
-
Main Usage
Visualizes quantitative data through bar length comparison for market research, competitive analysis, and consumer behavior studies. The 5-item structure allows viewers to instantly grasp numerical differences, making it suitable for decision-making presentations and strategic planning documents.
-
How to Use
Deploy this slide during business strategy development phases to compare market size, consumption trends, and competitor market share. Edit the bar lengths and values to match your dataset, then arrange the 2 slides sequentially within your presentation flow for maximum impact.
-
Recommended For
Marketing managers, business planners, financial analysts, and sales directors benefit from this template when presenting quantitative data in reports, proposals, and business plans. Particularly effective for consumption pattern analysis, sales volume comparison, and market share visualization.
-
Slide Structure
2-slide template featuring 5-item horizontal bar charts on each slide. Layout includes a brown sidebar on the left with 'More choices and visual trends' text, silhouette figures in the center, and a 5-step bar graph (value01 through value05) on the right side with clear numerical labels.
Related Products
-

Data Comparison: Then vs. Now – Performance and Competitive Edge
#Business Strategy #Market and Competitor Analysis #Graph
-

Visualizing Plant Growing Market Size – Achievements and Competitive Edge
#Business Strategy #Market and Competitor Analysis #Graph
-

Visually Enhanced Bar Graph by Promotional Product Performance
#Business Strategy #Market and Competitor Analysis #Graph
-

Growing Demand for Organic Agricultural Products Bar Chart
#Business Strategy #Market and Competitor Analysis #Graph
