Rainbow Presentation Template Infographic Elements – Market Share Analysis
RJ0200022_14
- Last Update 04/03/2025
- File Size 3.8MB
- # of Slides 2
- File Format PPTX
- Slide Ratio 16:9
- Color
Keywords
- #Content-Based Slides
- #Design-Based Slides
- #Business Vision and Strategy
- #Market and Competitor Analysis
- #Graph
- #Business Goals
- #Market Share
- #Other
- #Other Charts
- #16:9
- #grid infographic PowerPoint slide
- #ratio comparison chart template
- #market share analysis slide
- #data visualization PPT
- #infographic elements download
About the Product
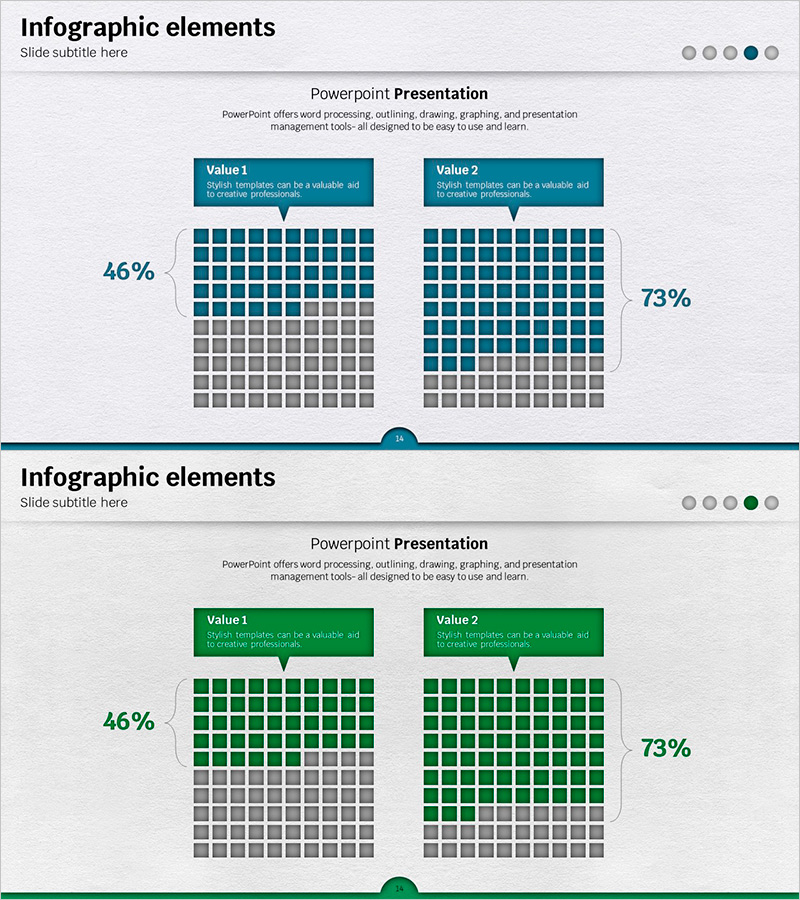
A grid-based infographic PowerPoint slide optimized for market share analysis and data comparison. This presentation template visualizes two values using a 100-cell grid structure, displaying data like 46% versus 73% in an intuitive, at-a-glance format. Two color versions—dark blue and green—are included to match corporate branding. Label boxes and arrows at the top of each section provide clear information hierarchy. Perfect for business reports, competitive analysis, performance metrics, and market positioning slides in pitch decks and strategic presentations.
Usage Points
-
Main Usage
Visualizes the ratio difference between two data values using a grid-fill method, making market share, achievement rates, and competitive comparisons immediately clear and impactful for stakeholders.
-
How to Use
Enter item names in the left and right label boxes, input percentage values, and adjust grid colors for instant use. Deploy in business report performance sections, marketing strategy market analysis pages, and investor pitch decks to explain competitive advantage.
-
Recommended For
Business analysts, marketing managers, executives preparing reports, and investor relations professionals who need to present quantitative comparisons effectively. Ideal for market share, customer satisfaction, and goal achievement rate visualizations.
-
Slide Structure
2-slide set. Each slide features a title area, two 100-cell grids (left and right), percentage values on sides, three label boxes (Value 1, Value 2, description), and dark blue and green color theme variants.
Related Products
-

User Gender Ratio Analysis Graph – Visualizing Market Share
#Market and Competitor Analysis #Graph #Customer Analysis
-

Business Development Status Diagram – Market Share and Competitive Analysis
#Product/Service Introduction #Market and Competitor Analysis #Diagram
-

Casualty Ratio Graph – Market Share Analysis
#Market and Competitor Analysis #Graph #Market Share
-

Aurora Camping Customer Analysis Chart
#Market and Competitor Analysis #Graph #Market Share
