Casualty Ratio Graph – Market Share Analysis
RJ0800019_11
- Last Update 08/04/2025
- File Size 4.7MB
- # of Slides 2
- File Format PPTX
- Slide Ratio 16:9
- Color
Keywords
About the Product
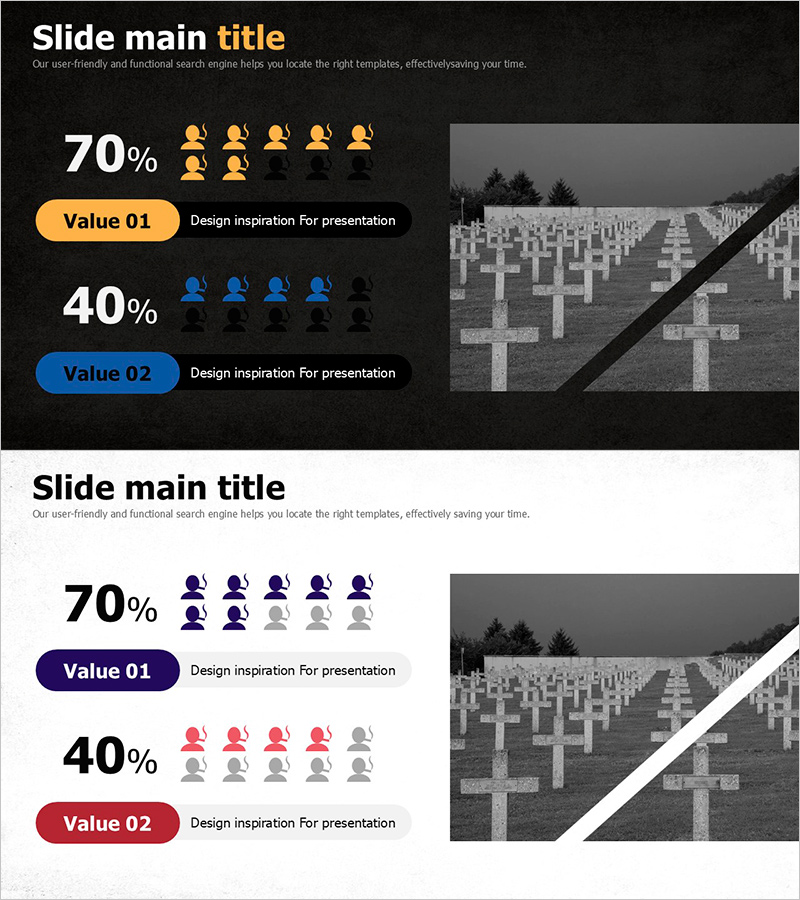
An icon-based infographic ratio chart PowerPoint slide that visualizes market share and competitive positioning with clarity and impact. Display key metrics like 70% and 40% through intuitive icon representation, with both dark and light background versions included. This 16:9 two-slide set integrates seamlessly into presentations for marketing analysis, business reports, and competitive strategy discussions, enabling data-driven decision-making at a glance.
Usage Points
-
Main Usage
Visualize market share and competitive landscape in marketing analysis, business reports, and strategy presentations using data-driven icon representation. The icon-count method makes percentages instantly comprehensible to audiences and supports transparent, evidence-based decision-making discussions.
-
How to Use
Customize the icon count and color coding to match your actual market data. Use the dark background version for premium, formal presentations and the light version for approachable, friendly contexts. Add supporting text and detailed metrics to strengthen your analytical narrative.
-
Recommended For
Ideal for marketing managers, strategy teams, sales executives, and investor pitches. Perfect for market research presentations, quarterly performance reviews, new business proposals, and competitive strategy workshops where data credibility is essential.
-
Slide Structure
Two-slide layout presenting 70% and 40% ratio scenarios. Each slide features a large percentage figure on the left, icon array (5 icons with color emphasis), centered label text area, and background image on the right. Dark and light background versions (one slide each) allow flexible adaptation to different presentation environments.
Related Products
-

Aurora Camping Customer Analysis Chart
#Market and Competitor Analysis #Graph #Market Share
-

Rainbow Presentation Template Infographic Elements – Market Share Analysis
#Business Vision and Strategy #Market and Competitor Analysis #Graph
-

Business Development Status Analysis Graph – Key Insight Visualization
#Product/Service Introduction #Market and Competitor Analysis #Graph
-

Business Development Status Diagram – Market Share and Competitive Analysis
#Product/Service Introduction #Market and Competitor Analysis #Diagram
