Stylish Diagram Slide for Visualizing Ratios
RJ0400044_8
- Last Update 05/29/2025
- File Size 0.4MB
- # of Slides 2
- File Format PPTX
- Slide Ratio 16:9
- Color
Keywords
About the Product
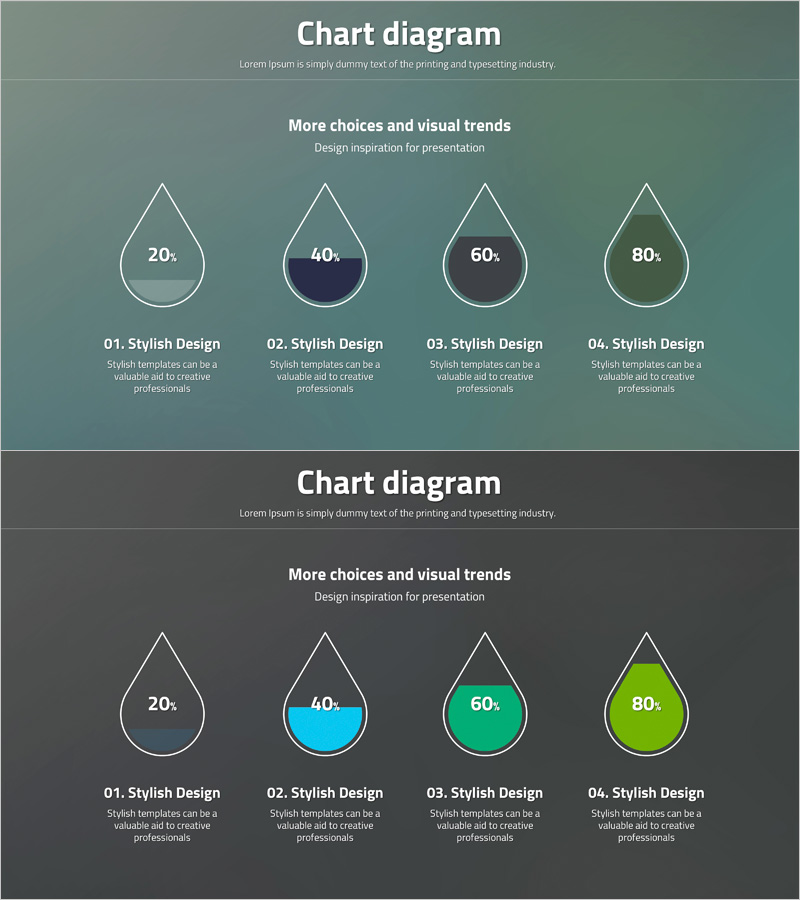
A professional water drop-shaped diagram PowerPoint slide designed for ratio visualization and data comparison. Features four teardrop shapes displaying 20%, 40%, 60%, and 80% values with progressive color gradients (gray to blue to green to lime) that intuitively convey data progression. The 2-slide set includes background variations in gray and dark tones, optimized for 16:9 widescreen format. Perfect for business presentations, quarterly reports, marketing analysis, and performance reviews where numerical comparisons and stage-by-stage progress need clear visual representation in your presentation slides.
Usage Points
-
Main Usage
Visualizes ratios, progress stages, and step-by-step numerical data using water drop shapes and color gradients. Effectively communicates achievement rates, goal completion percentages, and stage-by-stage growth metrics from 20% to 80% across four distinct levels.
-
How to Use
Ideal for quarterly business presentations, performance reports, marketing campaign progress tracking, and project completion status displays. Simply edit the numerical values and labels within each water drop shape to match your specific data and presentation needs.
-
Recommended For
Executives, marketing managers, project managers, and sales leaders who need to present data-driven performance metrics. Particularly valuable for quarterly results presentations, goal achievement tracking, and stage-by-stage progress explanations.
-
Slide Structure
2-slide set with background variations in gray and dark tones. Each slide features four water drop shapes arranged horizontally, containing numerical values (20%, 40%, 60%, 80%) and labels (Stylish Design) inside. Progressive color gradients represent incremental growth stages.
Related Products
-

Business Development Status Analysis Graph – Key Insight Visualization
#Product/Service Introduction #Market and Competitor Analysis #Graph
-

Doughnut Chart for System Development Status Progress Visualization
#Product/Service Introduction #Market and Competitor Analysis #Graph
-

Business Development Status Diagram – Market Share and Competitive Analysis
#Product/Service Introduction #Market and Competitor Analysis #Diagram
-

Business Idea Development Status Graph – Ideas and Growth
#Product/Service Introduction #Market and Competitor Analysis #Graph
